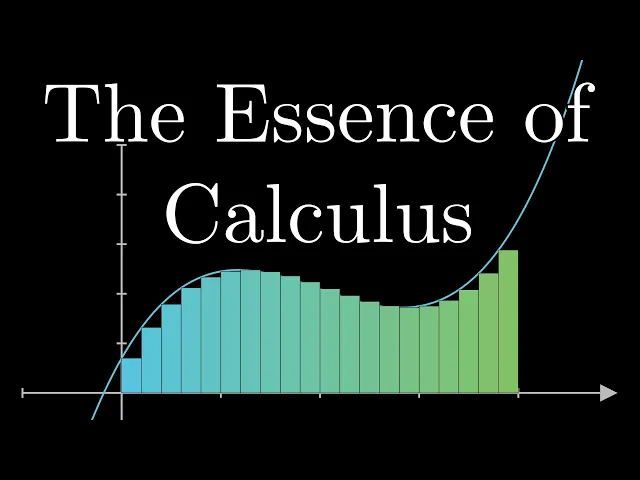
The essence of calculus
3Blue1Brown
0:14 Hey everyone, Grant here.
0:16 This is the first video in a series on the essence of calculus,
0:19 and I'll be publishing the following videos once per day for the next 10 days.
0:24 The goal here, as the name suggests,
0:25 is to really get the heart of the subject out in one binge-watchable set.
0:30 But with a topic that's as broad as calculus,
0:32 there's a lot of things that can mean,
0:34 so here's what I have in mind specifically.
0:36 Calculus has a lot of rules and formulas
0:39 which are often presented as things to be memorized.
0:42 Lots of derivative formulas, the product rule,
0:44 the chain rule, implicit differentiation,
0:46 the fact that integrals and derivatives are opposite,
0:49 Taylor series, just a lot of things like that.
0:52 And my goal is for you to come
0:54 away feeling like you could have invented calculus yourself.
0:57 That is, cover all those core ideas, but in a way that makes clear where
1:01 they actually come from, and what they really mean,
1:04 using an all-around visual approach.
1:06 Inventing math is no joke,
1:08 and there is a difference between being told why something's true,
1:11 and actually generating it from scratch.
1:14 But at all points, I want you to think to yourself,
1:17 if you were an early mathematician,
1:19 pondering these ideas and drawing out the right diagrams,
1:22 does it feel reasonable that you
1:23 could have stumbled across these truths yourself?
1:26 In this initial video, I want to show how you might stumble into the core ideas
1:31 of calculus by thinking very deeply about one specific bit of geometry,
1:35 the area of a circle.
1:37 Maybe you know that this is pi times its radius squared, but why?
1:41 Is there a nice way to think about where this formula comes from?
1:45 Well, contemplating this problem and leaving yourself
1:47 open to exploring the interesting thoughts that come
1:50 about can actually lead you to a glimpse of three big ideas in calculus,
1:55 integrals, derivatives, and the fact that they're opposites.
1:59 But the story starts more simply,
2:01 just you and a circle, let's say with radius 3.
2:05 You're trying to figure out its area,
2:07 and after going through a lot of paper trying different
2:10 ways to chop up and rearrange the pieces of that area,
2:13 many of which might lead to their own interesting observations,
2:16 maybe you try out the idea of slicing up the circle into many concentric rings.
2:22 This should seem promising because it respects the symmetry of the circle,
2:25 and math has a tendency to reward you when you respect its symmetries.
2:30 Let's take one of those rings,
2:32 which has some inner radius r that's between 0 and 3.
2:36 If we can find a nice expression for the area of each ring like this one,
2:39 and if we have a nice way to add them all up,
2:42 it might lead us to an understanding of the full circle's area.
2:46 Maybe you start by imagining straightening out this ring.
2:50 And you could try thinking through exactly what
2:53 this new shape is and what its area should be,
2:55 but for simplicity, let's just approximate it as a rectangle.
3:00 The width of that rectangle is the circumference of the original ring,
3:03 which is 2 pi times r, right?
3:05 I mean, that's essentially the definition of pi.
3:08 And its thickness?
3:10 Well, that depends on how finely you chopped up the circle in the first place,
3:14 which was kind of arbitrary.
3:16 In the spirit of using what will come to be standard calculus notation,
3:20 let's call that thickness dr for a tiny difference
3:22 in the radius from one ring to the next.
3:25 Maybe you think of it as something like 0.1.
3:28 So approximating this unwrapped ring as a thin rectangle,
3:32 its area is 2 pi times r, the radius, times dr, the little thickness.
3:38 And even though that's not perfect, for smaller and smaller choices of dr,
3:42 this is actually going to be a better and better approximation for that area,
3:46 since the top and the bottom sides of this shape are
3:49 going to get closer and closer to being exactly the same length.
3:53 So let's just move forward with this approximation,
3:55 keeping in the back of our minds that it's slightly wrong,
3:58 but it's going to become more accurate for smaller and smaller choices of dr.
4:03 That is, if we slice up the circle into thinner and thinner rings.
4:07 So just to sum up where we are,
4:09 you've broken up the area of the circle into all of these rings,
4:13 and you're approximating the area of each one
4:16 of those as 2 pi times its radius times dr,
4:19 where the specific value for that inner radius ranges from 0
4:22 for the smallest ring up to just under 3 for the biggest ring,
4:26 spaced out by whatever the thickness is
4:29 that you choose for dr, something like 0.1.
4:33 And notice that the spacing between the values
4:35 here corresponds to the thickness dr of each ring,
4:38 the difference in radius from one ring to the next.
4:42 In fact, a nice way to think about the rectangles approximating each ring's
4:46 area is to fit them all upright side by side along this axis.
4:50 Each one has a thickness dr,
4:52 which is why they fit so snugly right there together,
4:55 and the height of any one of these rectangles
4:58 sitting above some specific value of r,
5:01 like 0.6, is exactly 2 pi times that value.
5:04 That's the circumference of the corresponding
5:06 ring that this rectangle approximates.
5:09 Pictures like this 2 pi r can get tall for the screen,
5:12 I mean 2 times pi times 3 is around 19,
5:14 so let's just throw up a y axis that's scaled a little differently
5:18 so that we can actually fit all of these rectangles on the screen.
5:23 A nice way to think about this setup is to draw the graph of 2 pi r,
5:26 which is a straight line that has a slope 2 pi.
5:30 Each of these rectangles extends up to the point
5:32 where it just barely touches that graph.
5:36 Again, we're being approximate here.
5:37 Each of these rectangles only approximates the area
5:40 of the corresponding ring from the circle.
5:42 But remember, that approximation, 2 pi r times dr,
5:46 gets less and less wrong as the size of dr gets smaller and smaller.
5:51 And this has a very beautiful meaning when we're looking
5:54 at the sum of the areas of all those rectangles.
5:57 For smaller and smaller choices of dr,
5:58 you might at first think that turns the problem into a monstrously large sum.
6:03 I mean, there's many many rectangles to consider,
6:05 and the decimal precision of each one
6:06 of their areas is going to be an absolute nightmare.
6:10 But notice, all of their areas in aggregate
6:12 just looks like the area under a graph.
6:15 And that portion under the graph is just a triangle,
6:19 a triangle with a base of 3 and a height that's 2 pi times 3.
6:24 So its area, 1 half base times height,
6:27 works out to be exactly pi times 3 squared.
6:31 Or if the radius of our original circle was some other value,
6:35 capital R, that area comes out to be pi times r squared.
6:39 And that's the formula for the area of a circle.
6:42 It doesn't matter who you are or what you typically think of math,
6:45 that right there is a beautiful argument.
6:50 But if you want to think like a mathematician here,
6:52 you don't just care about finding the answer,
6:55 you care about developing general problem-solving tools and techniques.
6:59 So take a moment to meditate on what exactly just happened and why it worked,
7:03 because the way we transitioned
7:05 from something approximate to something precise is
7:08 actually pretty subtle and cuts deep to what calculus is all about.
7:13 You had this problem that could be
7:16 approximated with the sum of many small numbers,
7:18 each of which looked like 2 pi r times dr,
7:21 for values of r ranging between 0 and 3.
7:26 Remember, the small number dr here represents our choice
7:29 for the thickness of each ring, for example 0.1.
7:33 And there are two important things to note here.
7:36 First of all, not only is dr a factor in the quantities we're adding up,
7:40 2 pi r times dr, it also gives the spacing between the different values of r.
7:46 And secondly, the smaller our choice for dr, the better the approximation.
7:52 Adding all of those numbers could be seen in a different,
7:55 pretty clever way as adding the areas
7:57 of many thin rectangles sitting underneath a graph,
7:59 the graph of the function 2 pi r in this case.
8:02 Then, and this is key, by considering smaller and smaller choices for dr,
8:07 corresponding to better and better approximations of the original problem,
8:11 the sum, thought of as the aggregate area of those rectangles,
8:15 approaches the area under the graph.
8:19 And because of that, you can conclude that the answer to the original question,
8:23 in full unapproximated precision,
8:24 is exactly the same as the area underneath this graph.
8:30 A lot of other hard problems in math and science can
8:34 be broken down and approximated as the sum of many small quantities,
8:38 like figuring out how far a car has traveled
8:41 based on its velocity at each point in time.
8:44 In a case like that, you might range through many different points in time,
8:48 and at each one multiply the velocity at that time times a tiny change in time,
8:52 dt, which would give the corresponding little
8:55 bit of distance traveled during that little time.
8:59 I'll talk through the details of examples like this later in the series,
9:03 but at a high level many of these types of problems
9:06 turn out to be equivalent to finding the area under some graph,
9:09 in much the same way that our circle problem did.
9:13 This happens whenever the quantities you're adding up,
9:16 the one whose sum approximates the original problem,
9:19 can be thought of as the areas of many thin rectangles sitting side by side.
9:24 If finer and finer approximations of the original
9:27 problem correspond to thinner and thinner rings,
9:30 then the original problem is equivalent to finding the area under some graph.
9:36 Again, this is an idea we'll see in more detail later in the series,
9:40 so don't worry if it's not 100% clear right now.
9:43 The point now is that you, as the mathematician having just solved a problem
9:48 by reframing it as the area under a graph,
9:50 might start thinking about how to find the areas under other graphs.
9:55 We were lucky in the circle problem
9:57 that the relevant area turned out to be a triangle,
10:00 but imagine instead something like a parabola, the graph of x2.
10:04 What's the area underneath that curve,
10:07 say between the values of x equals 0 and x equals 3?
10:12 Well, it's hard to think about, right?
10:15 And let me reframe that question in a slightly different way.
10:18 We'll fix that left endpoint in place at 0, and let the right endpoint vary.
10:26 Are you able to find a function, a of x,
10:29 that gives you the area under this parabola between 0 and x?
10:35 A function a of x like this is called an integral of x2.
10:40 Calculus holds within it the tools to figure out what an integral like this is,
10:44 but right now it's just a mystery function to us.
10:47 We know it gives the area under the graph of x2
10:50 between some fixed left point and some variable right point,
10:52 but we don't know what it is.
10:55 And again, the reason we care about this kind of question
10:58 is not just for the sake of asking hard geometry questions,
11:02 it's because many practical problems that can
11:04 be approximated by adding up a large number
11:07 of small things can be reframed as a question
11:10 about an area under a certain graph.
11:13 I'll tell you right now that finding this area, this integral function,
11:17 is genuinely hard, and whenever you come
11:19 across a genuinely hard question in math,
11:21 a good policy is to not try too hard to get at the answer directly,
11:25 since usually you just end up banging your head against a wall.
11:30 Instead, play around with the idea, with no particular goal in mind.
11:34 Spend some time building up familiarity
11:36 with the interplay between the function defining the graph,
11:39 in this case x2, and the function giving the area.
11:44 In that playful spirit, if you're lucky, here's something you might notice.
11:48 When you slightly increase x by some tiny nudge dx,
11:52 look at the resulting change in area,
11:54 represented with this sliver I'm going to call da for a tiny difference in area.
12:01 That sliver can be pretty well approximated with a rectangle,
12:05 one whose height is x2 and whose width is dx.
12:09 And the smaller the size of that nudge dx,
12:11 the more that sliver actually looks like a rectangle.
12:16 This gives us an interesting way to think about how a of x is related to x2.
12:22 A change to the output of a, this little da, is about equal to x2,
12:26 where x is whatever input you started at, times dx,
12:30 the little nudge to the input that caused a to change.
12:34 Or rearranged, da divided by dx,
12:36 the ratio of a tiny change in a to the tiny change in x that caused it,
12:42 is approximately whatever x2 is at that point.
12:46 And that's an approximation that should get better
12:48 and better for smaller and smaller choices of dx.
12:52 In other words, we don't know what a of x is, that remains a mystery.
12:56 But we do know a property that this mystery function must have.
13:00 When you look at two nearby points, for example 3 and 3.001,
13:04 consider the change to the output of a between those two points,
13:10 the difference between the mystery function evaluated at 3.001 and 3.001.
13:16 That change, divided by the difference in the input values,
13:19 which in this case is 0.001,
13:22 should be about equal to the value of x2 for the starting input,
13:26 in this case 3 squared.
13:30 And this relationship between tiny changes
13:32 to the mystery function and the values
13:35 of x2 itself is true at all inputs, not just 3.
13:39 That doesn't immediately tell us how to find a of x,
13:41 but it provides a very strong clue that we can work with.
13:46 And there's nothing special about the graph x2 here.
13:49 Any function defined as the area under some graph has this property,
13:53 that da divided by dx, a slight nudge to the output of a divided
13:57 by a slight nudge to the input that caused it,
14:00 is about equal to the height of the graph at that point.
14:06 Again, that's an approximation that gets better
14:08 and better for smaller choices of dx.
14:11 And here, we're stumbling into another big idea from calculus, derivatives.
14:17 This ratio da divided by dx is called the derivative of a, or more technically,
14:22 the derivative is whatever this ratio approaches as dx gets smaller and smaller.
14:28 I'll dive much more deeply into the idea of a derivative in the next video,
14:32 but loosely speaking it's a measure of how sensitive
14:34 a function is to small changes in its input.
14:37 You'll see as the series goes on that there
14:40 are many ways you can visualize a derivative,
14:42 depending on what function you're looking at and how
14:44 you think about tiny nudges to its output.
14:48 We care about derivatives because they help us solve problems,
14:52 and in our little exploration here,
14:54 we already have a glimpse of one way they're used.
14:57 They are the key to solving integral questions,
15:00 problems that require finding the area under a curve.
15:04 Once you gain enough familiarity with computing derivatives,
15:07 you'll be able to look at a situation like
15:10 this one where you don't know what a function is,
15:12 but you do know that its derivative should be x2,
15:15 and from that reverse engineer what the function must be.
15:20 This back and forth between integrals and derivatives,
15:23 where the derivative of a function for the area under
15:26 a graph gives you back the function defining the graph itself,
15:30 is called the fundamental theorem of calculus.
15:34 It ties together the two big ideas of integrals and derivatives,
15:38 and shows how each one is an inverse of the other.
15:44 All of this is only a high-level view,
15:46 just a peek at some of the core ideas that emerge in calculus.
15:50 And what follows in this series are the details,
15:52 for derivatives and integrals and more.
15:54 At all points, I want you to feel
15:57 that you could have invented calculus yourself,
15:59 that if you drew the right pictures and played
16:01 with each idea in just the right way,
16:03 these formulas and rules and constructs that are presented could
16:06 have just as easily popped out naturally from your own explorations.
16:12 And before you go, it would feel wrong not to give
16:15 the people who supported this series on Patreon a well-deserved thanks,
16:18 both for their financial backing as well as for the suggestions
16:21 they gave while the series was being developed.
16:24 You see, supporters got early access to the videos as I made them,
16:27 and they'll continue to get early access for future essence-of type series.
16:32 And as a thanks to the community,
16:33 I keep ads off of new videos for their first month.
16:37 I'm still astounded that I can spend time working
16:39 on videos like these, and in a very direct way,
16:41 you are the one to thank for that.