We Found a Giant Structure In Space and We Don’t Know What It Is
Astrum Extra
0:00 Our planet is haunted.
0:06 Now, you might think that is an odd thing to claim for an astronomy channel,
0:14 but there have been whispers among astronomers that something is out there.
0:22 Ghostly specters lurking in our orbital path.
0:28 Entities that have eluded scientific detection for decades,
0:38 drifting in perfect balance between cosmic forces.
0:46 Some claim to have captured faint images of these ethereal
0:50 silhouettes looming up to nine times wider than Earth itself.
0:55 Yet others have searched the same regions of space and found nothing at all.
1:02 For over six decades, astronomers have debated their existence.
1:07 Are these mysterious entities merely elaborate optical illusions?
1:12 Or something truly extraordinary hiding in plain sight?
1:18 What celestial phenomenon could simultaneously be
1:21 so large yet remain so elusive?
1:26 Is the moon truly Earth's only companion in our journey around the sun?
1:32 I'm Alex Mccoan and you're watching Astramm.
1:36 Today, we're investigating one of astronomy's most enduring mysteries,
1:41 the controversial ghost moons that may be
1:44 silently accompanying our planet through the cosmos.
1:52 This ghost story begins in 1961 when Polish astronomer Kazmir Cordfki
1:59 first spotted two diffuse patches of sky that kind of looked
2:04 like clouds through a telescope which were located suspiciously near
2:09 the stable L4 and L5 Lrangee points of our Earth moon system.
2:15 In case you aren't familiar with Lrangee points, let me quickly explain.
2:21 Lrangee points are positions in space where
2:24 the gravitational forces of two large bodies
2:27 are balanced by the centropedal force required
2:30 for a smaller object to move with them.
2:33 This creates a sort of gravitational equilibrium that allows the smaller
2:37 objects to maintain a position relative to the two larger bodies.
2:42 Lrangee points were named after
2:43 the Italian French astronomer and mathematician Ysef
2:46 Louie Lrange after he published a prize-winning
2:51 paper about this phenomenon in 1772.
2:55 While we're going to be talking about the Lrangee
2:58 points present in our Earth Moon system in this video,
3:01 similar points exist for other two body systems such as between
3:05 the Earth and the Sun or Jupiter and the Sun.
3:10 In any two body system,
3:12 there are five spots where gravitational forces and orbital motion
3:16 create these lrangee points and they're labeled L1 through L5.
3:21 Three of these L1, L2, and L3 are considered unstable.
3:27 Small objects may be temporarily captured near these points like the NASA
3:32 issa satellite SOHO at L1 or the James Web Space Telescope at L2.
3:38 But they have to make corrections to their altitude
3:40 and course every 23 days to avoid drifting out of position.
3:45 Objects in these unstable equilibrium points are balancing on a metaphorical
3:50 knife's edge and any slight push from the solar wind,
3:54 radiation or the moon's gravity will tip the balance.
3:58 But L4 and L5, these positions are stable.
4:03 Unlike the other Lrange points,
4:05 these each make equilateral triangles with the Earth
4:09 and Moon and are resistant to gravitational pertubations.
4:13 Because of this, objects like asteroids
4:16 and dust tend to accumulate in these areas.
4:19 And that's where our story picks up.
4:23 Cordelpski's observation of these ghostly faint clouds in the [music] L4
4:27 and L5 Lrange points originally named liberation clouds but later known
4:32 as Cordeli dust clouds ignited a scientific debate that has lasted
4:37 for decades one that is still going on to this day.
4:43 Immediately following his observation, other astronomers,
4:46 both professional and amateur, attempted to locate these supposed clouds.
4:50 [music] But for years, nobody else could find them.
4:54 At the time, observational techniques were far less advanced than today.
4:59 Many astronomers questioned whether these dust
5:01 clouds were real or merely optical illusions.
5:04 After all, detecting such faint structures against
5:08 the darkness of space was a challenging proposition.
5:12 That skepticism persisted for years.
5:15 Every now and then, an astronomer would catch a glimpse
5:18 of a dust cloud in one lrangee point or the other,
5:21 and sometimes clouds would be visible in both locations.
5:25 A few astronomers, including Cordowski himself,
5:28 captured photographs of the clouds, but for years,
5:32 the dust clouds appeared so faint in the photos
5:34 that they could not be reproduced in newspapers.
5:38 These photos aren't like photos we're used to either.
5:42 Images of these dust clouds have to be taken using photometric techniques,
5:47 which involves glass photographic plates with long exposure times
5:51 to capture the faint lights of distant celestial objects.
5:56 They aren't of Hubble telescope quality.
5:59 They serve more to identify changes in light [music] intensity.
6:03 And this is what astronomers would use as evidence of the cloud's existence.
6:09 In 1966, NASA organized an airborne observation mission from its Converair 9990
6:15 jet laboratory operating far from city lights at an altitude of 12,000 m.
6:22 The astronomers on those four NASA flights were able to identify
6:26 Cordelia dust clouds in both the L4 and L5 Lrange points,
6:31 even managing to photograph the dust cloud at L5.
6:34 The orbiting solar observatory OSO6 also observed the clouds in 1966
6:41 and subsequent work was published measuring their brightness and size.
6:45 However, in 1976, another astronomer named Sigfrieded Aruza at the Max
6:52 Plank Institute for Astronomy used numerical simulations to show
6:56 that conditions were unfavorable for dust to accumulate in the L4
7:00 area and questioned whether or not these clouds actually existed.
7:06 Most of the KDC skeptics believe
7:09 that the gravitational pertubation of the sun, solar wind,
7:12 and other planets have too strong of a destabilizing effect
7:16 on the L4 and L5 Lrange points for KDC's to be maintained.
7:21 Additionally, radar studies of the clouds
7:24 around this time had produced negative results,
7:27 leading many to believe there was
7:29 nothing of circumstance at Little Grange points.
7:33 These doubts were further reinforced in 1983 when
7:37 observers using a 61 cm telescope near Tucson,
7:41 Arizona found no such clouds in either L4 or L5.
7:47 Yet just a few years later in 1989,
7:50 [music] the clouds were photographed again by astronomer Vinyoski
7:56 from an astronomical observatory in the Bastardada mountains in Poland.
8:00 Vinyoski observed the KDC's to be a few degrees in apparent diameter.
8:06 These were also the first three color phototric observations
8:10 of the clouds and they revealed that the clouds appeared
8:12 much redder than the counterglow which is the sunlight
8:16 that gets scattered by the general dust particles in space.
8:19 This observation suggested that the dust in the KDC's is
8:23 significantly different in composition to the other local space dust.
8:28 Which begs the question, where are these apparations coming from?
8:34 But then once again, the existence of KDC's was brought into question
8:39 when in 1991 the Japanese heightened space probe
8:43 did one loop around the L4 and L5
8:46 forrange points in an attempt to detect dust particles,
8:49 but didn't manage to find any.
8:52 However, astronomers say that this should not
8:55 be taken as evidence against the dust clouds,
8:57 as he highen was only able to do one loop around each Lrangee point.
9:02 And if the clouds do exist, the dust was likely moving too slowly for it
9:07 to be picked up by Heiten's dust detectors.
9:10 So, as you can see, the scientific debate that begun in 1961
9:15 after Cordel's initial observation is one
9:18 that has continued through the decades.
9:23 But now scientists seem to have made a breakthrough.
9:27 In 2018 and 2019, astronomer Udit Slisbalo and physicists
9:33 Gabbor Hvath and Andreas Bart were able to present
9:37 clear evidence of the L5 KDC by examining
9:41 how the dust creates patterns of scattered polarized light.
9:45 To do this, they use a type of photography called polarized imaging,
9:50 which uses a series of filters that can show light bouncing at specific angles.
9:55 When light hits these dust particles,
9:57 it scatters differently depending on the specific
10:00 composition and arrangement of the particles,
10:02 offering clues to the nature of the clouds.
10:05 After collecting a series of images through various polarized filters,
10:09 the scientists found that the patterns of polarized
10:12 light in the images matched theoretical predictions
10:15 for what we would expect to see
10:16 from sunlight that were scattered by dust clouds.
10:19 What's more, in their 2018 paper on the observations,
10:23 they said that in fact these results meant
10:26 that the scatters cannot be anything other than dust particles.
10:31 To back up these observations,
10:32 they were able to further understand the formation
10:35 of the clouds at L5 through the use of computer simulations.
10:39 They calculated the motion of 1.86 million dust particles to see how dust
10:44 in that region of space might behave and found that under the right conditions,
10:49 that dust could get trapped at the L5 point and remain there for a long time.
10:55 The result of these simulations were dust clouds that mirrored the shape
10:59 and size of what had been observed by the polarized imaging.
11:03 Very small particles spread over a large area.
11:08 So what is going on here?
11:11 Why could some astronomers see these dust clouds and photograph
11:14 them while others claimed they didn't exist at all?
11:18 The answer may lie in the structures themselves.
11:24 Despite spanning roughly 100,000 km by 70,000 km,
11:29 which is almost nine times wider than the Earth,
11:32 the total mass of the dust clouds is supposedly extremely small.
11:37 Not to mention, the particles themselves are likely micron or submicron sized,
11:43 a similar size to many bacterial cells.
11:46 According to observations from the polarized imaging of L5,
11:50 a micron is already a very tiny measurement at 1 millionth of a meter.
11:56 Individual particles of this size are
11:58 only visible through a powerful microscope.
12:03 Not only are the KDCs composed of these micron or submicron dust particles
12:08 sparsely spread across a wide area and nearly invisible to the naked eye,
12:13 but the recent models made by Slbalo and Horvath in 2018 suggest
12:18 that the shape of the L5 dust cloud also appears to be [music] dynamic.
12:23 The models point to the structure
12:25 being nonuniform with dust particle density varying
12:30 across the KDC and changing over time
12:33 in synchrony with the moon's orbital period.
12:37 This could also support the idea that KDC's
12:40 are not a stagnant accumulation of dust,
12:43 but rather that they may be continuously losing and refreshing their contents.
12:49 kind of like an ever evolving dust storm rather than a fixed stable cloud.
12:55 Things like solar wind or gravitational pull from the sun or other
12:59 planets may disrupt the delicate equilibrium
13:02 that holds together these dust clouds,
13:04 causing them to disperse before reforming again.
13:09 This combination of extremely tiny particles that are dispersed over
13:13 a large area and the possibility that these clouds may form,
13:17 disperse, and reform again and again over time could
13:22 help to explain the discrepancy in observations over three decades.
13:27 However, the tentative confirmation of the L5 KDC
13:31 in 2018 still leaves open scientific debate as to whether
13:35 these clouds exist continuously or whether they appear and disappear
13:40 depending on the influence of the sun and other planets.
13:44 Plenty of questions remain about cordfki dust clouds, but one thing is certain,
13:50 these observations are not just a mirage,
13:52 but a real phenomenon within our Earth moon system.
13:56 Even though aspects of their structure,
13:59 evolution, and composition remain under investigation,
14:02 there is broad acceptance that KDC's are worthy of further study.
14:11 While these so-called ghost moons that orbit
14:14 the Earth moon lrange points may seem otherworldly,
14:18 our planet is no stranger to additional moons.
14:21 In fact, Earth has had several mini moons and quasi moons before,
14:25 albeit very different from the KDC's.
14:28 For one thing, mini moons typically come and go within a year,
14:31 while the gravitational traps or lrange points,
14:34 which are theorized to cause these cordleski dust clouds,
14:37 have existed since our Earth moon system formed,
14:40 making the KDC phenomenon potentially billions of years old.
14:45 Another distinct difference is that mini moons and quasimoons are solid
14:49 objects whereas dust clouds are of course clouds of loose dust.
14:55 Quasimoons get their name because from one vantage point they
14:59 look as if they are true moons orbiting the earth.
15:02 However, with a wider view, these turn out to be asteroids orbiting the sun.
15:07 Mini moons, on the other hand, are objects that rarely orbit a planet.
15:12 They tend to be quite small and difficult to detect,
15:14 which is probably why we've only ever managed to identify four mini moons,
15:19 none of which are orbiting Earth anymore.
15:22 Take for example the mini moon called 2020 CD3,
15:26 which I discussed in a previous video.
15:28 This small natural satellite was captured in Earth's
15:31 orbit between January 2019 and May 2020,
15:35 temporarily giving our planet a second moon.
15:38 Well, mini moon.
15:40 In my opinion, our planet's possible ghost moons are perhaps the most
15:44 exciting of these obscure types of moons because of how unique they are.
15:53 Despite being dynamic structures,
15:55 these dust clouds are a long-term feature of our Earth Moon system,
16:00 and we still have so much to learn about them.
16:02 Observing these dust clouds has tested
16:05 the limits of our observational abilities.
16:08 And as our technology and science improves, so can our understanding of KDC's.
16:14 We should aim to build up more observation data of the L4 KDC.
16:18 as this feature is historically under represented compared to the cloud at L5.
16:24 We could also reservey the clouds using methods like radar to see
16:28 if technological improvements can yield
16:30 different results compared to the negative
16:32 detections of the past as this would further establish the presence
16:36 of these elusive features and fend off any lingering skeptics.
16:40 But now that they've been broadly accepted by the scientific community,
16:45 future research can begin to explore how KDC's are replenished over time,
16:50 their potential impact on space weather,
16:52 and their influence on satellite operations.
16:56 Whether KDC's exist continuously or appear and disappear over time,
17:01 at least now we know that something really is out
17:04 there and we can study them with the right focus.
17:08 These ghostly dust clouds continue to haunt our skies,
17:12 reminding us that even the faintest spooky traces of cosmic
17:16 apparitions can hint at something palpable and is worth investigating.
17:24 When 15 supernova go off close together,
17:27 both in time and proximity, it makes quite a bang.
17:31 It should be of no surprise that such a violent event
17:35 should fundamentally transform the region of space around where it occurred.
17:40 Interstellar dust was swept aside from the forces of those concurrent blasts,
17:45 creating a monumental void of low density matter and a shock wave that continues
17:51 to hurtle across the galaxy to this day at a rate of 6 km a second.
17:58 In its wake, plasma reaching 1 million degrees C in temperature.
18:04 This simultaneous Swiss cheesing and heating up
18:08 of the interstellar medium is what is now called a hot bubble and represents
18:13 both the end of stars and their beginning.
18:17 But this is not some distant structure that lurks
18:20 in a far away corner of the universe.
18:23 Our solar system isn't even heading right towards it.
18:27 We are in it charging for its point of origin head first.
18:34 Welcome to our local hot bubble.
18:38 What scientists now realize is the local
18:41 environment that exists around our solar system.
18:45 It is a neighborhood we are still exploring,
18:48 but its nature is becoming clearer and clearer.
18:52 So, what do we know about the local hot bubble?
18:56 How did it form?
18:57 And what more is there to be discovered?
19:01 I'm Alex Mccoan and you're watching Astramm.
19:04 Join me today as we walk in the aftermath of exploding stars and discuss
19:09 how scientists even determined we were
19:12 in the heart of a cataclysm to begin with.
19:18 The local hot bubble was not always something we knew about.
19:22 First identified in the 1970s from observations of low
19:27 energy X-ray emissions that were detected over the entire sky,
19:31 the local hot bubble was hypothesized to be a large cavity in the interstellar
19:36 medium called a superbubble filled with tenuous
19:41 million degree low density [music] gas.
19:45 In the 1990s, scientists found that X-ray emissions could
19:48 happen anywhere neutral atoms interacted with the solar wind,
19:52 challenging the idea that the emissions must point to a large hot bubble.
19:57 But soon, evidence would reveal that the hypothesis
20:01 from decades earlier was indeed correct.
20:05 In 2014, NASA confirmed the existence of the LHB through
20:10 the diffuse X-ray emission from the local galaxy mission known as DXL.
20:17 While soft background radiation can come from other sources,
20:21 like from comets, for example, the mission found that only 40% of the fog
20:26 of low energy X-rays came from within our solar [music] system.
20:31 This affirmed that the dominant source was diffuse X-ray emissions emanating
20:36 from the millionderee region of interstellar plasma known as the [music] LHB.
20:43 Although this confirmed the bubble,
20:45 questions remained about what could create such a massive void
20:49 and what might explain the thousands of surrounding young stars.
20:54 The prevailing answer proved to be both violent and [music] fascinating.
21:00 Recent research suggests that the local hot bubble was the aftermath of around
21:05 15 supernova explosions that occurred sequentially within
21:09 a span of a few million years,
21:12 erupting in relatively close proximity to one another.
21:15 Scientists estimated that the first of these massive
21:18 stellar explosions went off roughly 14 million years ago,
21:23 each expelling enormous amounts of energy,
21:26 pushing out the surrounding interstellar material and heating
21:30 the remaining gas [music] to extreme temperatures.
21:34 Evidence of these ancient explosions has been
21:36 preserved in our Earth's geological record in deep
21:40 sea [music] sediment deposits in the form of a special isotope called iron 60.
21:46 This radioactive isotope can come from a few different sources,
21:50 but the most common source of iron 60 is believed to be supernova explosions.
21:56 [music] We know that the source of the isotope
21:59 is extraterrestrial because the earth itself has no way
22:02 of producing iron 60 on its own and [music]
22:06 matching deposits have been found on the moon as well.
22:10 The reason that this radioactive isotope is special is
22:13 because [music] we know how long its half-life is.
22:17 We know that it decays into cobalt 60, another radioactive isotope,
22:21 [music] before it finally decays into nickel 60, a stable element.
22:26 Iron 60 has a halflife of 2.6 million years and cobalt
22:31 60 has a fairly short halflife of just 5.3 years.
22:37 Because of this, when we find a deposit that [music] contains these elements,
22:41 scientists can compare the amounts of iron 60,
22:44 cobalt 60, and nickel 60 like an elemental clock
22:48 to reveal when that material was deposited [music] on our planet.
22:53 And luckily for us, international research teams have found
22:56 several such deposits over the last couple of decades.
23:02 In 2016, iron 60 deposits were found
23:05 in deep sea crust samples taken from the Pacific, Indian, and Atlantic oceans,
23:11 indicating two distinct spikes in the radioactive debris that [music]
23:15 pointed to several supernova events in the notsodistant past.
23:19 And not too far from our solar system, just 326 lighty years away,
23:27 the sample showed a spike of iron 60 between 3.2 and 1.7 million years ago,
23:33 and another spike between 6.5 [music] and 8.7 million years ago.
23:39 Nuclear physicist Anton Walner,
23:41 who led one of these research teams studying the deposits,
23:44 said that the fact that the more
23:46 recent debris was spread across 1.5 million years,
23:50 suggests that there were a series of supernova
23:52 that occurred one after another in close succession.
23:57 Astrophysicist Dieter Breitvert who led a second
24:00 team of scientists [music] identified a likely source
24:03 of these supernova explosions which would have occurred
24:07 196 to 423 lighty years from the sun.
24:12 These supernova that created our local hot bubble may have been part of an aging
24:18 star cluster whose surviving members are now
24:21 associated with the Scorpius Centura stellar group.
24:25 Using the iron 60 deposits,
24:27 the team was able to trace the signals of two supernova,
24:31 one that happened 1.5 million years ago
24:33 and the other 2.3 million years ago as the result
24:36 of the deaths of stars that were 8.8 times
24:40 and 9.2 times the mass of our sun, respectively.
24:44 In fact, our LHB is still growing today,
24:48 albeit much more slowly than when the supernova exploded millions of years ago.
24:53 The speed of expansion has plateaued at about 6 km/s now,
24:58 according to astrophysicist [music] Katherine Zucker.
25:01 In 2022, Zucker authored a groundbreaking paper
25:05 that reconstructed the evolution of our galactic neighborhood,
25:08 tracing the chain of events that created our local hot bubble and led
25:13 to the formation of all the young stars we see nearby today.
25:17 From there, they made an incredible discovery.
25:21 Using data from the European Space Ay's Gaia telescope,
25:25 Zucker and her team were able to construct a 3D space-time map,
25:30 showing that within 500 lighty years of our planet,
25:34 all of the young stars and star forming regions
25:36 reside on the surface of our local hot bubble.
25:40 With these 3D positions and the 3D motions of the stellar clusters,
25:46 they traced back 20 million years of star
25:48 formation history near our local hot bubble.
25:51 The implications were clear that all of the well-known
25:55 star forming regions near our solar system had
25:58 formed along the outer edge of the local
26:01 bubble as it swept up gas during its expansion.
26:06 Stella nurseries are a field we are learning more about all the time.
26:10 particularly as new images are taken by our telescopes.
26:14 Here's a spectacular image of the Chameleon 1 dark cloud,
26:18 one of our nearest stellar nurseries taken
26:21 by a dark energy camera on the Victor M.
26:24 Blanco 4 m telescope [music] at Cherro Talo Interamerican Observatory.
26:29 By studying the propagation of starlight from within it,
26:33 scientists can tease out details about how stars form,
26:36 which might help us better understand the local
26:38 hot bubbles impact on our galaxy today.
26:41 You might not have seen this particular image before
26:44 as new space news is coming out all the time,
26:47 but I've talked about it in my newsletter,
26:50 which I've recently launched to help you keep up with all
26:52 the breathtaking photos released by our many telescopes on Earth and in orbit,
26:57 or new breakthroughs that reshape how we understand the cosmos.
27:02 You should sign up to never miss the most exciting news,
27:05 even if the headlines do, by following the link in the description below.
27:09 There are new editions that come out every Thursday.
27:13 From the local hot bubbles birth 14 million years ago,
27:17 Zucker and her colleagues identified four epochs
27:20 of star formation on the bubble shell.
27:25 Starting about 16 million years ago,
27:27 we see the birth of the upper centurus lupus or the UCL star cluster,
27:33 followed by the lower centurus crux or LCC star cluster.
27:39 These formed about 49 light years apart
27:41 from one another and about 14 million years ago.
27:45 These stellar populations were the source of the stars
27:48 that went supernova to create our local bubble.
27:54 About 10 million years ago,
27:55 we see the first of the four star forming epochs after the formation of the LHB.
28:01 The upper scorpius association and older afucuca
28:05 stella populations are born in the first epoch.
28:09 6 million years ago the second star forming epoch
28:12 formed Corona Arralis and the older stars of Taurus.
28:18 Then around 2 million years ago the stars in Lupus and Chameleon as well
28:24 as younger stellar populations of Taurus and ofucus
28:28 came to be in the third epoch.
28:31 And finally, our present time falls within the fourth star forming epoch.
28:37 We can observe the dense star forming molecular gas that surrounds the LHB,
28:42 which will eventually lead to more star
28:45 clusters being born along the bubble's outer edge.
28:49 With all of this stellar creation,
28:52 you might be surprised to learn that we are interlopers.
28:56 Our sun did not form inside the local bubble.
29:01 In fact, the sun was about 978 light years away
29:05 when the first supernova went off in UCL and LCC,
29:10 only joining up with the LHB about 5 million years ago
29:14 as its path through the galaxy took it into the bubble.
29:18 With the trajectory shown in yellow dots,
29:20 you can see our sun's location just before it entered the bubble.
29:25 And now, just by coincidence,
29:27 our sun happens to be located near the [music] center of the LHB.
29:33 Drifting into the heart of what was once a [music] raging furnace,
29:37 scientists became interested in mapping out
29:39 the ongoing temperature within the local bubble.
29:43 You might wonder why we're so calm if
29:45 temperatures of plasma here can reach 1 million° C.
29:50 The key lies in that plasma's density.
29:54 Look, this 3D map from Zucker's 2022 publication
29:59 shows our local hot bubble in dark blue.
30:03 The density inside our bubble is extraordinarily low,
30:06 containing about 100 times less hydrogen than the typical interstellar medium.
30:12 So while the temperature of this gas soarses to around 1 million° Kelvin,
30:17 giving rise to the diffuse X-ray emissions
30:19 we have observed around the whole sky, we don't have much to worry about.
30:25 Tracking temperatures within the local bubble
30:27 has provided more evidence of its existence.
30:30 The extended renen survey with an imaging telescope array,
30:35 better known as the e-roisa x-ray telescope,
30:38 has been able to gather the most detailed all sky survey of soft x-rays to date.
30:44 And that data has been used to map the LHB
30:47 and our solar neighborhood in much more detail than before.
30:51 launched aboard the joint Russian and German mission
30:55 Spectrum Renen Gamma or Spectre RG in 2019.
31:00 Data from the E Rosita X-ray telescope has allowed a team
31:04 of scientists led by the Maxplank
31:06 Institute for Extraterrestrial Physics to create
31:09 a 3D map of the LHB and identify a temperature gradient
31:14 where the galactic south was slightly hotter than the galactic north.
31:19 This temperature dichotomy could be explained by supernova
31:23 explosions in the past few million years.
31:26 And by creating this bubble map, the team also found that the LHB is
31:30 stretched out towards the poles of the galactic hemisphere.
31:34 This is because the hot gas in the bubble
31:36 expands out in the direction with the least resistance,
31:39 which happens to be away from the Milky Way's galactic disc.
31:44 Along with identifying temperature variations and the shape of the bubble,
31:48 the team compiled this and other data to create
31:51 an even more detailed map of our galactic neighborhood.
31:56 In the new 3D map, our local hot bubble looks like
32:00 a three-dimensional splatter surrounded
32:03 by and even overlapping other galactic structures.
32:07 These other structures represent known supernova remnants like the Gum Nebula
32:12 shown here in red and dense molecular clouds shown here in orange.
32:19 With the new data and 3D maps,
32:22 these super bubbles seem likely to be common in our galaxy,
32:26 creating a Milky Way that's sort of like Swiss cheese.
32:31 The cavities of our Swiss cheese galaxy
32:34 are blasted out by gigantic supernova explosions
32:38 with new stars forming along the edges of the holes created by dying stars.
32:43 And like Swiss cheese, it appears that some of these super bubbles may
32:48 have tunnels connecting them to other bubbles or other structures,
32:52 suggesting our local hot bubble could be part
32:56 of an intricate network of similar features throughout our galaxy.
33:01 For example, we have the Canis Majorus Tunnel,
33:05 which lies on the Milky Way's galactic disc and is believed
33:08 to connect [music] our local hot bubble to the Gum Nebula,
33:11 or another larger nearby superb bubble.
33:14 But the 3D map also revealed another previously
33:18 unknown interstellar tunnel stretching towards the constellation Centurus,
33:24 possibly connecting our local bubble to the neighboring Loop One super bubble.
33:31 While these interstellar tunnels are tantalizing,
33:34 our current understanding of them is limited.
33:38 Nevertheless, these tunnels of hot gas and bubbles of star
33:42 formation shaped [music] by the death of gigantic older
33:45 stars has me in awe of how powerful and interconnected
33:50 the evolution of our local galactic neighborhood really is.
33:55 It suggests that stars are not just born and die in isolation,
33:59 but that their energetic output continues to mold
34:02 the environment for millions of years after their demise.
34:06 And as our observational tools become more sophisticated,
34:10 we are beginning to uncover the extent of these hidden structures.
34:16 So next time you look up at the night sky,
34:19 you might remind yourself that we are surrounded by crazy patterns.
34:24 just like our local bubble in the Milky
34:26 Way that was carved out by ancient cataclysms.
34:30 And that some of those stars that you see are actually plastered along the walls
34:35 of a supernova blasted cavity which connects
34:39 to other parts of the galaxy through interstellar tunnels.
34:44 Wow.
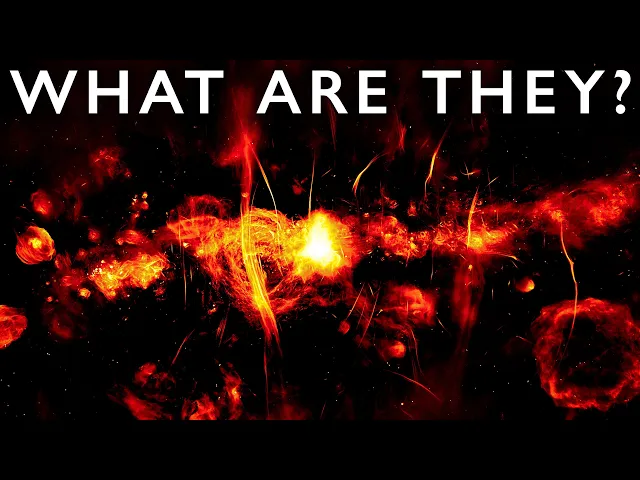
34:49 In 2022, this astonishing image was published.
34:53 [music] What makes it so astonishing?
34:57 Well, this is one of the most detailed radio images
35:01 of the center of our galaxy that's ever been produced.
35:06 Assembled from the first survey using the full array
35:10 at the [music] MCAT radio observatory in South Africa.
35:13 This image took three years of data analysis
35:16 to complete and it is revealing something thoroughly bizarre.
35:21 Deep within the turbulent chaos at the center of the Milky Way are hundreds
35:26 of highly ordered one-dimensional filament-like structures dangling
35:32 [music] inexplicably above and below the galactic center.
35:37 These enigmatic filaments [music] stretch for up to 150
35:41 lightyear yet are only one to three lightyears across.
35:47 The big question [music] is what are these strange superersized strands?
35:53 Now scientists are trying to unpick this mircat image to work [music] it out.
35:59 I'm Alex Mccoan and you're watching Astramm.
36:02 Join me today as we uncover the mysteries
36:04 around one of the Milky Way's weirdest phenomena.
36:08 We'll explore the happy accident that led to their discovery
36:11 and the extreme characteristics that are leaving scientists baffled.
36:18 The center of the Milky Way,
36:21 27,000 light-years from Earth, is a [music] place of violence.
36:26 This innermost region, the central molecular zone,
36:30 spans 1,600 light-year and is by all accounts
36:34 [music] the most extreme part of our galaxy.
36:38 Density, temperature, and turbulent velocity, a measure of chaotic fluid motion,
36:44 are around 1 to two orders of magnitude
36:48 higher here than anywhere else in the galaxy.
36:52 The cosmic ray energy density, a proxy for [music] energetic activity,
36:57 is 2 to three orders of magnitude higher.
37:01 This region is home to vast complexes of molecular gas,
37:06 about 20 million solar masses worth,
37:09 dense cosmic clouds, ionized plasmas, extreme cosmic ray energy,
37:16 ultraviolet and x-ray radiation, and turbulent magnetic fields.
37:22 It is a hotbed of [music] cosmic activity
37:24 from the formation of stars to exploding supernova.
37:28 And let's not forget Sagittarius [music] a star,
37:31 the super massive black hole 4 million times the mass
37:34 of our sun at the very center of it all.
37:39 These conditions are hugely exciting for astronomers,
37:43 but they make the galactic center notoriously hard to image.
37:48 Visible light can't penetrate the dense clouds of dust and [music] gas.
37:52 So researchers turned to other parts of the electromagnetic spectrum to lift
37:57 the veil and reveal the secrets at the heart of the galaxy.
38:02 Radio waves have the longest wavelengths of the electromagnetic
38:06 spectrum from a few millime to hundreds of kilome
38:10 and the wavelengths in the range of millime
38:13 to [music] tens of meters are ideal for radio astronomy.
38:18 They pass through the obscuring clouds of gas and dust,
38:21 giving us a clear view of what lies beneath.
38:25 In the early 1980s, Furhad Ysef Zade studying
38:29 for his PhD was using the very large
38:32 array telescope in New Mexico to produce a radio
38:36 map of a section of the galactic center.
38:39 He was planning to study star forming regions,
38:42 [music] but narrow strips of radio emission were streaking across
38:46 the entire survey area right through the parts he was interested in.
38:51 He thought they must be artifacts in the data or imaging errors,
38:56 which any scientist will tell you is highly annoying.
39:00 So after much frustration and no luck resolving the problematic artifacts,
39:05 he returned to the VA to image again at another frequency.
39:10 And that was when his Eureka moment struck.
39:14 At 400 a.m.
39:15 one morning, he was comparing the two
39:17 samples taken at different times using different wavelengths,
39:21 and he saw the same structures in both images.
39:26 This was no artifact.
39:28 This was a very real finding, something unlike anything he or anyone else
39:35 for that matter had come across before.
39:39 Zade was seeing highly ordered structures where previously only chaos
39:45 was thought to exist and they had some very unusual features.
39:50 Most striking was their vast scale.
39:54 These were continuous narrow strips of radio
39:56 emission 50 to 100 light-years long, but only 1 to three light-years wide,
40:03 dangling vertically above and below the central molecular zone,
40:08 the most extreme part of the Milky Way.
40:11 Some appeared in pairs or clusters running parallel
40:14 to each other like strings on a harp,
40:17 each separated [music] by a standard distance of around one astronomical unit,
40:22 the distance between Earth and the Sun.
40:25 When he cross-cheed them with the infrared data from that area,
40:28 Zarde also discovered they had no counterpart in that area of the spectrum.
40:35 This told him they were non-therrmal emissions.
40:38 That is to say they were not produced by heated gases.
40:42 This was corroborated by other measurements
40:45 such as spectral index and polarization which showed that [music] the filaments
40:49 were highly magnetic and emitting synretron radiation.
40:55 Synretron radiation occurs when electrons moving near the speed
40:59 of light interact with a strong magnetic field.
41:02 which begged the question, what on Earth,
41:04 or should I say not on Earth, was accelerating the electrons to such speeds.
41:11 The emissions along the length of the structures were continuous,
41:15 ruling out localized events like star formation or supernova remnants.
41:20 So, Zade dubbed them non-therrmal filaments and suggested
41:25 they were likely related to galactic scale phenomena.
41:29 His observations didn't correspond to anything else in the known galaxy.
41:33 And Zarde had many more questions.
41:36 Where did the non-thermal filaments come from?
41:40 What was maintaining their linear structures over
41:43 such vast distances of space and time?
41:47 Why, when clustered, were they so evenly spaced?
41:52 But almost as soon as this startling discovery was made,
41:55 the trail started to go cold.
41:58 The available telescopes at the time simply
42:00 didn't have the sensitivity needed to provide answers.
42:05 Over the next 35 years, only a handful of other vertical
42:10 non-therrmal filaments were revealed and categorized.
42:14 Some were even given inigmatic names like the snake, pelican, and bent harp.
42:21 Sadly, there wasn't enough data to make
42:23 any great leaps forward in understanding.
42:26 Well, not until 2022.
42:29 [music] And Miaat's mindblowing image.
42:34 The Miaat radio telescope at the South Africa
42:36 Radio Astronomy Observatory or SARo is comprised of 64
42:41 interlin antennas each with a 13.5 m diameter parabolic
42:47 dish spread over 8 km of radio silent zone.
42:52 Built over four years, the full array was inaugurated in 2018.
42:58 Its location in the southern hemisphere is [music]
43:00 perfect for imaging the center of the Milky
43:02 Way thanks to our sun's axle tilt relative to its own position in the galaxy.
43:08 So, Miaat has a direct line of [music]
43:11 sight into the CMZ and the galactic center.
43:15 Over the course of 3 years, an international team led by Dr.
43:19 Ian Haywood and including Zarde, now professor at Northwestern University,
43:25 directed Mia Cat to a 6.5 square degree portion of the galaxy,
43:31 a section of the sky around 30 full moons wide with Sagittarius A star
43:37 right in the middle using Lband radio frequencies of 856 to [music] 1,712 MHz,
43:46 equivalent to wavelengths of 18 to 35 cm.
43:51 They split this area into a 20part mosaic,
43:56 directing the telescope to survey each tile in turn
43:59 over a total of 144 hours on target.
44:04 This was the first time Mircat's full array was used
44:09 with 60 to 62 dishes sampling the sky at any one time.
44:14 After generating 70 terabytes of raw data,
44:18 the equivalent to 700 hours of 4K YouTube content,
44:23 the team then had to process it.
44:26 That was no mean feat.
44:28 Given the complexity of the environment,
44:30 they needed to put the data through a highpass
44:32 filter using a method called difference of Gaussians.
44:37 This is a commonly used edge smoothing technique to remove
44:40 background noise and enhance the [music] visibility of fine structures,
44:44 especially important for visualizing non-therrmal filaments.
44:48 And this is the result.
44:52 More like a work of art than a scientific study,
44:56 it captures a wealth of features.
44:59 Some are wellnown like Sagittarius A star seen in the central saturated area
45:04 here and clearer views of previously
45:06 known supernova remnants and star forming regions.
45:10 This here is a supernova remnant.
45:13 To its left is a runaway pulsar, the mouse and up on the right one
45:19 of the longest and most famous non-therrmal filaments, the snake.
45:25 As noted by the team, one of the most startling discoveries was
45:29 the sheer number of filaments apparent in the image,
45:33 an order of magnitude greater than all previously known,
45:37 most of which had never [music] been seen before.
45:41 This was game-changing for Zard and his colleagues.
45:45 Now we finally see the big picture.
45:48 A panoramic view filled with an abundance of filaments.
45:51 He said this is a watershed in furthering our understanding of these structures.
45:57 There was finally enough data to carry out meaningful population studies.
46:01 They set to work carrying out statistical analysis of the filaments.
46:07 This work published in the astrophysical journal letters not only
46:11 further categorizes the filaments but gives tantalizing clues to their origin.
46:17 The new data confirmed that all of them are magnetized.
46:21 In fact, the team found that the magnetic
46:23 field was significantly greater in some
46:26 cases up to 10 to 100 times stronger than typical galactic magnetic fields.
46:32 The new analysis also confirmed
46:34 that synretron radiation is a defining characteristic.
46:39 Interestingly, the MICAT data revealed that there
46:42 is a steepening with galactic latitude.
46:46 In other words, the filaments appear to cool
46:49 as they stretch away from the galactic plane.
46:52 This gives us a clue as to their possible origin.
46:56 The electrons further away from the galactic plane could be older,
47:00 implying that the filaments are related to past activity of Sagittarius a star.
47:07 And there was another clue that suggested this too.
47:10 Enormous structures known as radio bubbles.
47:14 First discovered by Haywood Zade and the Miacat team in 2019,
47:20 these huge radio emmitting structures stretch
47:23 symmetrically above and below the galactic plane,
47:27 forming an hourglass shape thousands of light years across.
47:32 They are thought to have been created by a phenomenal outburst
47:36 from Sagittarius a star about 100,000 to a million years ago.
47:41 An event powerful enough to leave such a scar
47:45 on the galaxy could have been vast quantities of gas
47:48 and dust falling into the black hole or a huge
47:53 and sudden burst in star formation close by.
47:56 An incident like this would have triggered an intense
47:59 outburst of energy and whipped up galactic winds,
48:02 driving gas and cosmic rays violently away from the galactic center,
48:07 stretching and amplifying magnetic field lines in its wake,
48:10 creating those bubbles and non-therrmal filaments.
48:14 What's more, strong magnetic fields,
48:17 which as we now know are a confirmed characteristic of all filaments,
48:21 capture cosmic rays.
48:23 And the great thing is we can date [music] them.
48:26 Those detected in the filaments by a mircat match the proposed period
48:31 of the Sagittarius A star outburst considered responsible for the radio bubbles.
48:37 In other words, they are the same age.
48:41 The position and capabilities of Mircat alongside the same
48:45 highpass filtering used to resolve the non-therrmal radio filaments
48:49 not only revealed these bubbles in astonishing detail but showed
48:53 almost all of the filaments are confined within them.
48:56 This close physical association adds even more weight
49:00 to the argument that the same energetic event created them.
49:04 Something powerful enough to create the bubbles would certainly
49:08 be able to accelerate electrons to near the speed
49:10 of light with the stretch magnetic field lines
49:13 channeling them to produce the filament's signature synretron emission.
49:17 With this hypothesis in mind,
49:19 Zard and the team described the formation of non-therrmofilaments
49:23 as magnetized streamers in a cosmic raydriven [music] wind.
49:28 It certainly paints a compelling picture
49:30 for the possible origin of the filaments,
49:32 but it is by no means conclusive as even the authors themselves attest.
49:37 Other theories are being worked on.
49:40 With a mystery this tantalizing,
49:41 other astronomers have been studying the filaments, too.
49:45 But this single image is still the one that's told us the most.
49:49 Zard wasn't kidding when he said it was a watershed moment.
49:54 But with so many unanswered questions,
49:56 some going back 40 years, where does that leave us?
50:01 Are non-thermal radios merely a galactic curiosity?
50:07 Not by any means.
50:09 They are a riddle wrapped in a mystery inside an enigma
50:13 and could shed light on one of the biggest unanswered questions out there.
50:17 How super massive black holes regulate star formation within a galaxy.
50:23 Scientists know that the active centers of galaxies must transfer energy
50:26 and matter into interstellar [music] space
50:28 through a process called galactic feedback.
50:31 If they didn't, star formation would run away unchecked,
50:35 using up a galaxy's gas and dust faster than observations tell us.
50:39 But how this feedback happens is unknown.
50:42 Mircat's detailed imagery of non-therrmal filaments and the radio
50:46 bubbles provides us with compelling evidence that this outflow
50:50 of energy could happen in discrete but powerful outbursts
50:54 and this is something that has been seen before.
50:58 Fermy bubbles discovered by NASA's Fermy gammaray telescope in 2010 are
51:03 even bigger hourglass shaped configurations
51:06 spanning a total of 50,000 lightyear.
51:10 These mindbogglingly massive structures colored magenta in this image
51:15 are thought to be millions of years old.
51:18 Likely caused by a violent outburst from Sagittarius A star,
51:22 which calculation suggests had the energy of 100,000 supernova.
51:29 This is much more powerful and [music] ancient than
51:32 the event proposed to have made the filaments and radio bubbles.
51:36 But together they paint a picture of intermittent
51:38 outbursts from deep within the heart of our galaxy.
51:42 Both have the potential to regulate star formation,
51:45 ensuring that the Milky Way doesn't suffer from burnout.
51:49 As scientists continue to unravel the mysteries of non-therrmof filaments
51:53 and tackle the big questions about how the universe works,
51:57 the trail doesn't seem to be going cold again anytime [music] soon.
52:01 Since the first full array image,
52:03 Mircat has found more of these mystery strands in other galaxies
52:07 with very similar properties to the ones we see in the Milky Way.
52:11 Their very existence elsewhere suggests a common underlying mechanism
52:16 that alludes [music] to their role in fundamental galactic processes.
52:21 To conclusively piece together the whole picture
52:23 will require another step change in imaging resolution.
52:27 And hopefully that's not too far off as MICAT already awarded by the Royal
52:33 Astronomical Society for its spectacular observations in radioastronomy
52:37 was built with longerterm goals in mind,
52:40 namely to be incorporated into [music] the square kilometer array.
52:45 With a total collecting area of one square km,
52:49 it will be 50 times more sensitive than any other radio instrument in existence.
52:54 and it's expected to be fully constructed by 2028.
52:58 Keeping an eye on developments in other parts
53:00 of the electromagnetic spectrum will be important too.
53:03 Zard believes that the next breakthrough
53:05 will come from [music] gamma ray telescopes.
53:08 Imaging at higher frequencies results in higher resolution imagery
53:12 which [music] has potential to show us whether the filaments,
53:14 the radio bubbles that contain them, and the vast fermy bubbles are connected.
53:20 There's an elegance in order rising out of chaos [music] and observing
53:24 non-therrmal filaments streaming out through
53:26 the cosmic winds certainly fits that notion.
53:30 So, keep watching this space.
53:32 And with images and phenomena this spectacular,
53:36 I certainly have no problem doing that.
53:40 If you've been following the Astramm Answer series recently,
53:43 you'll notice that we've talked a lot about how the universe is structured.
53:48 filament structures of galaxies being pulled apart by the universe's
53:52 expansion with bubbles or voids forming in the gaps.
53:58 Because of the universe's expansion, everything is moving away from everything.
54:03 But of course, this isn't totally true
54:05 in practice due to a mysterious force called gravity.
54:10 Gravity is a pulling force or technically it is
54:13 the curvature of spaceime caused by uneven distribution of mass.
54:19 On very small scales, gravity is hardly relevant at all.
54:23 I don't feel any pull towards objects around me,
54:26 only towards the earth because it is so massive.
54:30 Celestial objects close enough to the sun are most influenced by its gravity.
54:35 And all stars in the galaxy orbit around
54:37 a super massive black hole at the galaxy's core.
54:41 But it doesn't stop there.
54:43 You've probably heard that the Andromeda galaxy is hurtling towards us.
54:47 How can that be when everything is moving apart?
54:51 Gravity.
54:53 Objects that are close enough together with a large enough mass are
54:56 pulled towards each other by gravity faster than the universe can expand.
55:01 This is why we have galaxy superclusters.
55:04 And in fact, we are part of one.
55:06 Gravity is keeping these galaxy clusters bound together,
55:10 meaning over extremely large time scales, collisions aren't totally unusual.
55:16 In fact, a new theory has recently been proposed that the Milky Way may
55:20 have recently experienced a collision with a large
55:23 melanic cloud-sized diffused galaxy called Antlia 2.
55:28 Scientists have discovered that the Milky Way has ripples
55:31 consistent with it having had a collision in the past,
55:35 but we couldn't pinpoint what it collided with until Gaia
55:38 discovered the Anier 2 galaxy hidden behind our galactic disc.
55:43 This makes it very hard to spot as although it is massive,
55:47 it is very spread out due to the collision and being behind our galactic
55:51 disc makes it hard to see due to the stars and dust in the way.
55:57 But that brings us on to the main topic of this episode, the great attractor.
56:02 In an opposite vein from the supervoids video,
56:04 where there are regions of space where there is an almost total
56:08 absence of mass for hundreds of millions of light years in any direction,
56:12 the great attractor is the biggest concentration
56:15 of mass for hundreds of millions of light years.
56:18 It is so massive that even though our galaxy
56:21 is between 150 to 250 million lighty years away,
56:26 we and all galaxies around it are currently moving towards it.
56:31 Estimates put its mass at roughly 1,000 trillion suns,
56:35 which is enough for many thousands of galaxies.
56:39 But what could possibly be there that is that massive?
56:42 Well, for the longest time it was a total mystery because like Adlia 2,
56:48 the region where the great attractor is
56:50 located is hidden behind our galaxy's disc.
56:53 However, X-ray telescopes can see through the disc.
56:57 And recent technological improvements and advances in X-ray
57:01 telescopes have meant that we have been able
57:03 to detect thousands of galaxies in the region
57:06 where the great attractor is supposed to be.
57:08 But the mass detected didn't add up.
57:12 There wasn't enough present to create such a pull.
57:15 Further analysis has revealed something very interesting that while
57:19 we are being pulled towards the great attractor,
57:22 there is something even more massive behind it.
57:26 Located 650 million lighty years away called
57:29 the Chappley attractor or the Shappley supercluster.
57:32 Located there are many thousands of galaxies densely packed together with a mass
57:37 of 10,000 trillion suns and everything within
57:41 1 billion lightyear is being pulled towards it.
57:45 On the other hand, looking
57:47 the opposite direction from the Shappley supercluster,
57:49 we see an underdent region where everything seems
57:52 to be moving away from it called the dipole repeller.
57:57 It isn't actually repelling mass, but due to all the mass around it
58:01 being pulled towards more dense regions by gravity,
58:04 it creates the illusion that it is repelling that mass.
58:07 Although there are some scientists that do claim
58:10 that an unknown repelling force is at work there.
58:14 Simply put, we are still in very early
58:17 days when it comes to understanding the universe.
58:21 We do observe certain things like the motion of galaxies,
58:25 dense galaxy groups and absences of galaxies
58:28 in large voids or repelling regions.
58:32 We observe the expansion of the universe and observe the filamentary structures.
58:37 But the universe is an impossibly large place.
58:40 We can only see so far, only live so long.
58:44 Plus, our technology is limited.
58:47 We have theories which try and explain what we see.
58:50 But I really wouldn't be surprised to see
58:52 these theories change as more data becomes accessible.
58:55 Some may ask what's the point then?
58:58 However, I for one am hugely grateful for the bright minds working
59:02 on this as discovering our place in the universe is so fascinating.
59:07 I'm glad humans have an insatiable need
59:09 to explore and understand everything around them.
59:12 This innate sense of wonder and curiosity
59:14 is what drives the evolution of mankind, and I am excited to witness it.
59:22 A massive thank you to our astronauts on Patreon.
59:26 This video had no sponsors,
59:28 but it was still made possible thanks to the hundreds of members we have there.
59:32 Link is in the description to join our growing community.
59:36 Patreon is where Astramm truly takes shape.
59:39 A place for people who love space,
59:41 who want to see these videos keep improving and reaching more curious minds.
59:46 Every new member keeps the channel focused on what really matters,
59:50 making the complexity of space available to everyone.
59:53 If you enjoy what we do, come join the Astramm community today.