Operations Context for AI | Ontology in Fabric IQ
Microsoft Mechanics
0:02 The agents you build and use need the right operational
0:05 context of how your business runs to deliver the best outcomes.
0:08 Today, that context is often fragmented across systems,
0:12 defined differently by different teams, or buried in dashboards and logic,
0:17 making outcomes inconsistent and agent behavior hard to predict.
0:21 That's where Microsoft Fabric IQ comes in.
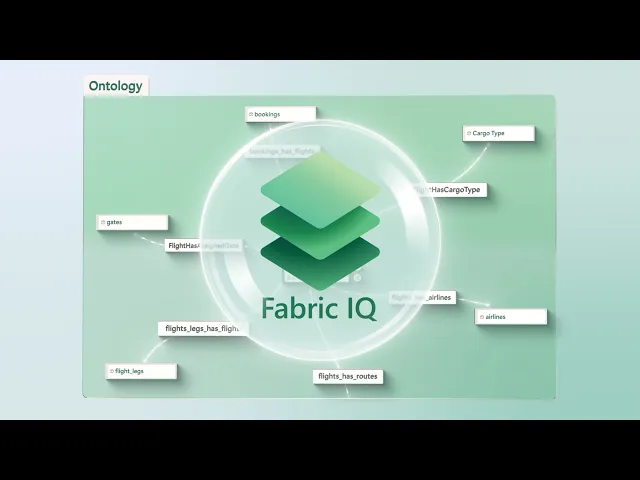
0:24 Fabric IQ introduces a semantic foundation
0:26 that unifies models and data through an ontology.
0:30 It defines the shared business entities and their relationships,
0:34 and connects them to your data.
0:36 It provides the operational context needed
0:38 to understand how the business actually runs,
0:40 without altering any underlying data.
0:43 Analysts can not only work with the data they already trust,
0:47 but also model how the business works.
0:49 And agents can use that same shared context to reason and act more consistently.
0:54 Today, I'll show you both sides.
0:56 First, how a data analyst leverages Fabric IQ inside a Fabric workspace,
1:01 using ontology to model the business concepts.
1:05 Then, how Fabric IQ uses the same context
1:08 to drive more reliable and predictable insights from agents.
1:12 I'll start from the point of view of an analyst looking
1:14 to create a full fidelity view of how an airline operates,
1:18 including processes such as ticketing, maintenance, and more.
1:22 The first thing I need to do is to create a new ontology.
1:25 I can either build one from scratch,
1:27 or jumpstart by using an existing Power BI semantic model.
1:31 As you see here, there's a new option
1:33 to generate an ontology from this semantic model.
1:36 I just need to choose the workspace, give it a name.
1:39 I'll choose AirlineOperationsOntology.
1:41 Then confirm by hitting Create.
1:43 In just a few clicks,
1:45 I'm able to see the different entities of our airline business.
1:48 All data is now linked not only through keys,
1:51 but also business relationships and semantics.
1:55 We can see flights, airlines, routes, and more.
1:58 If I click into airports,
2:00 because Fabric IQ is semantically aware of the relationships between entities,
2:05 it shows the routes connected to runways which are
2:08 in turn connected to airports And for any entity,
2:11 I can choose to add more live operational signals.
2:15 In this case, I want to add
2:17 details about the runway conditions using real-time data,
2:20 including contamination, visual range for visibility,
2:23 as well as the available cleared width and more.
2:27 And you can also bring in your Power BI reports
2:29 for a canonical view of how to monitor and manage these aircrafts.
2:34 From the ontology, I'll head over to the Report links
2:37 tab that opens the OneLake catalog with all of my reports.
2:41 I'll search for air and there are three matching reports for gates,
2:45 ground service, plus safety and runway.
2:47 So I'll add them and hit Connect to confirm.
2:51 So, in just a few clicks,
2:52 we've expanded our ontology with the live operational view,
2:56 using real-time signal, geospatial data, and more.
3:01 Now, as an analyst, I can work immediately with it,
3:05 and our agents can act on it as well.
3:08 Let's fast‑forward and see what I've unlocked.
3:10 You can see that I now have a richer view over my data,
3:13 which is connected to real‑world operations.
3:16 We're no longer optimizing one report or one dataset at a time.
3:21 We're looking at our operations across multiple data sources,
3:24 in the language of our business,
3:26 with meaning and relationships already understood.
3:30 Now let me show you how this makes it
3:32 easier to turn insights into concrete decisions and actions.
3:36 First, in the flight entity type overview,
3:39 I can see how it relates to my other business processes.
3:42 I see entities like bookings, gates, airlines, and more as a graph.
3:47 I have links to all of my connected Power BI reports.
3:50 There is a real-time weather data, including wind knots,
3:54 as well as geo-spatial insights showing all of my flights.
3:58 Using Fabric Maps, I have a fleet level view of all my active flights,
4:03 and I can see live air traffic across the fleet.
4:06 This, in fact, is a heat map view of three New York City area airports,
4:11 and we can see that JFK in this case is impacted with lots of runway activity.
4:16 I can now understand the system as a whole,
4:19 across bookings, flights, airports, and real‑time conditions.
4:23 And I can drill in further to understand what
4:26 is going on: I have opened the runways entity,
4:29 and you'll remember some of these categories from before.
4:32 Since there's snow in the area,
4:33 I can immediately see the runway conditions that affect operations,
4:37 things like surface friction and contamination levels,
4:40 so I understand how safe it is for planes to take off and land.
4:44 Beyond connecting raw data, I can also define rules directly in the ontology,
4:50 so this logic lives with the data and its business meaning,
4:53 instead of being hard coded somewhere else.
4:55 In this case, I'll add a rule that says
4:57 if runway contamination exceeds high threshold value of 25%,
5:02 notify the passengers proactively of upcoming delays.
5:05 We'll also notify the ground crew,
5:07 so they know that the runways need to be cleared.
5:10 The rules are now embedded in the ontology, and the value comes from seeing how
5:15 runway conditions impact the rest of the operations.
5:18 That's where the built‑in ontology graph helps.
5:21 Let's look at the relationship graph.
5:23 I'll expand the graph view.
5:25 And add a filter for JFK airport Then run the query.
5:29 No code needed here.
5:30 And I get a filtered view for JFK.
5:32 And immediately, I can see a poor condition that's affecting Runway 25R.
5:37 From that insight, it's easy to see the downstream impact.
5:40 This runway issue is already affecting related gates
5:43 and baggage operations that will need to be rescheduled.
5:47 This is a unified view of our entire operations
5:50 and how connected events will cascade across related business entities.
5:54 This is how ontology helps you as an analyst.
5:57 But remember, the same operational context is also available to AI agents,
6:01 no matter how you build them.
6:03 Let me demonstrate this in the context of one our built-in Fabric IQ agents.
6:08 From the New Item catalog,
6:10 you can find the built-in agents by searching for agent.
6:13 There is a Data agent designed to answer questions,
6:16 and an Operations agent designed
6:18 for real-time data and business action recommendations.
6:22 The Operations agent is a perfect fit for our airline operations scenario,
6:27 so I'll choose that one.
6:28 I want this agent to help with runway-related analysis and actions,
6:31 so I'll name it RunwayConditionsAgent, leave the location, and create it.
6:36 From there, I can add a bit more information to set up the agent,
6:39 like adding the business goals for what it
6:42 should accomplish I want this one to monitor
6:44 surface conditions for runways and ensure things run
6:47 smoothly based on logic like we used before.
6:50 In fact, in the Agent instructions, using natural language, no code,
6:55 I'll describe that if surface contamination is reported above 10%,
6:59 send ground crews to take care of it.
7:01 Likewise, the clear width should be more than 25 meters,
7:04 and the agent should send ground crew
7:06 to visually assess whether planes can safely brake.
7:09 Now let's add some knowledge.
7:11 And for that, I'll choose our AirlineOntology.
7:15 And here's where I can add actions.
7:17 I'll add one to assign ground crew for clearing,
7:19 along with description for what needs to be done.
7:22 Then I'll give it the Runway ID as the one
7:24 to clear and the Temperature to predict the type of clearing needed.
7:28 And Create to add that one.
7:30 Now I'll add another for requesting visual assessment,
7:33 and perform similar steps for the parameters.
7:36 These will send status updates in Microsoft Teams.
7:39 Now everything is defined and ready.
7:41 I just need to save this new agent.
7:44 That takes a moment.
7:45 And once it's finished,
7:46 it creates a nice agent playbook with what it's designed to do.
7:51 Now, with the agent running,
7:52 the right people will get notified of what to do in Microsoft Teams Here,
7:57 I'm looking at the Operations agent It's alerting us
8:00 that Runway 29L has only 22 meters of clear path.
8:05 This is under our 25 meter threshold.
8:08 It recommends to deploy the ground crew for a runway clearance operation.
8:12 As the human in the loop,
8:13 I can choose whether or not to proceed with the recommendation.
8:17 I'll do that.
8:18 Then it asks to confirm a few details.
8:20 They look good, so I'll confirm, and the ground crew is on its way.
8:24 And here is the good news.
8:26 If you're building your own agent
8:28 in Microsoft Copilot Studio or using Microsoft Foundry,
8:31 Fabric IQ ontology will be an integrated knowledge
8:34 source that you will be able to choose from.
8:37 As you choose your knowledge types, you can select Fabric IQ.
8:40 This will ground agents in the same
8:43 semantic foundation that already runs your operations.
8:46 And of course, the agents you build and connect to Fabric IQ
8:49 will respect the permissions and security
8:51 policies you already use in Fabric today.
8:54 As I have shown, Microsoft Fabric
8:56 IQ gives agents shared understanding, with entities, relationships, rules,
9:01 and actions so they can move from insight to decision more reliably.
9:06 To learn more and get started, check out aka.ms/FabricIQ.
9:11 Keep watching Microsoft Mechanics for the latest news and deep dives.
9:15 And thank you for watching.