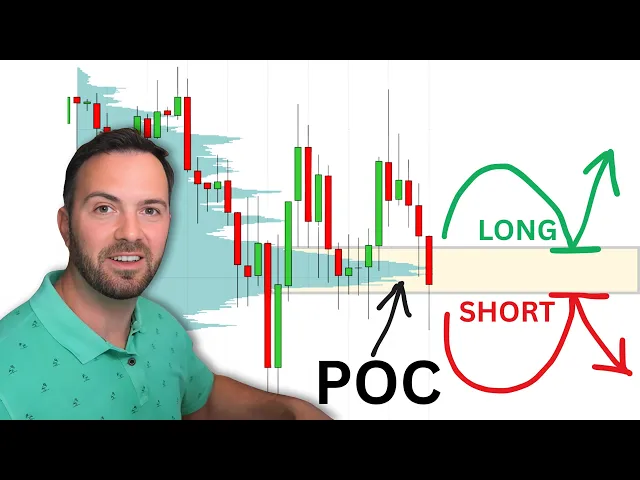
VOLUME PROFILE: How to Trade Point of Control (POC)
Trader Dale
0:02 Hello everyone, it's Dale here.
0:03 In this video, I'll show you how to use volume profile,
0:06 which is a powerful tool that reveals where the big players are trading.
0:11 And more importantly, we'll focus on the most critical level on the chart,
0:15 which is point of control.
0:16 And here is what you will learn.
0:18 You will learn what volume profile actually shows and how to read it.
0:22 You will learn why point of control is
0:25 the most powerful support and resistance level on your chart.
0:28 You will learn how to trade the point of control both the basic and more
0:34 advanced way and just as important when not to trade the point of control.
0:40 I'll walk you through real trades from my own account,
0:43 show you my exact strategy and also what to do
0:46 when the point of control fails because let's be honest,
0:50 it doesn't work every time.
0:51 And before we wrap up, I've got a small gift for you.
0:55 But you need to stay until the end.
0:57 And don't skip.
0:58 So, let's get to it.
1:00 And let's start with a little quiz so you guys know where you are at.
1:05 Okay.
1:06 So, take a look at this picture right here
1:09 on your screen and tell me where the price is going.
1:13 Is it going to go up or is the price continue to fall?
1:17 It's pretty hard, isn't it?
1:19 when you look just at this chart.
1:22 Pretty hard to tell.
1:23 Okay, let me help you a bit.
1:26 This is the same chart only what I've added is daily volume profiles.
1:32 Now, the same question.
1:33 Will the price go up or down?
1:36 Okay.
1:37 So, if you look at the volume profile, this one,
1:42 then right here, this is the point of control.
1:47 the price hit that point of control and made a reaction to it.
1:54 As you can see with a plain chart, plain price action chart,
1:59 it it was rather hard to guess where the price is going to go.
2:04 But with volume profile, it's actually very easy level to spot, right?
2:09 Because this is point of control.
2:11 And if you guys don't understand a thing
2:13 from what I'm showing you now, don't worry.
2:15 We'll get to it.
2:16 But you know this is just a little quiz
2:18 to get us started and to see where you are at.
2:22 Okay, second question and it's the same question as before.
2:26 Where is the price going to go?
2:29 Up or down?
2:31 Again, if we don't have the volume profile, it's quite hard to tell, right?
2:37 Just looking at the price.
2:39 But if we add the volume profile here,
2:42 then you can see that the price just hit the point of control which is in here.
2:49 The price just hit the point of control level.
2:54 So up we go.
2:56 Right?
2:56 This is a reaction to the point of control.
3:01 Now let's rewind a bit and let me start from the beginning.
3:04 Uh let me do a little introduction to what the volume profile is and then
3:08 we'll continue to you know the setups that I use to trade the point of control.
3:13 So volume profile is basically a histogram that shows volume at price.
3:19 So if you look at the volume profile, this is it.
3:24 And the wider the volume profile is.
3:27 For example, here the heavier volumes were traded at this price level.
3:32 Right?
3:32 This is called the point of control.
3:35 This level where the heaviest volumes were traded.
3:38 And essentially what the profile is showing you is
3:41 how the volumes were distributed throughout the whole day.
3:45 So heaviest volumes were in here.
3:47 Then there is area where there were some low volumes.
3:50 So at this price level, nobody was sort of interested in trading here.
3:55 Same goes for this area, right?
3:57 But this is the most important area because many
4:00 people were interested in trading at this uh price level.
4:04 All right?
4:04 So volume profile shows how volumes uh are distributed throughout the day.
4:09 If it's a daily profile, if it's a weekly profile,
4:13 then it will show how volumes are
4:16 distributed throughout uh throughout the whole week.
4:18 If it's a monthly profile then throughout the whole month
4:22 and as I was saying the point of control that's the place where
4:27 the heaviest volumes were traded this is the point of control and today
4:33 we are going to talk about that the volume profile can have
4:38 many shapes those are the four most basic ones but always
4:42 the most important place in each shape is the point of control right
4:48 So this is something called D-shaped profile because it has shape
4:52 of a letter D and right here this is its point of control.
4:57 If you look at the B-shaped profile then
4:59 the point of control is somewhere in here.
5:02 With a P-shaped profile you can see
5:04 that the heaviest volumes were traded in here.
5:07 So the point of control is in here.
5:09 And then with a thin profile sometimes it's a bit hard
5:12 to tell especially if there are a couple of volume clusters like here.
5:17 But I think looking at this profile that the point
5:20 of control the heaviest volumes were traded right here.
5:23 So in this case this is the point of control here.
5:27 Right?
5:28 So every volume profile has point of control no
5:31 matter what the shape of the volume profile is.
5:34 Right?
5:34 No matter how the volumes are distributed throughout the whole day and in each
5:39 of those shapes the point of control is the most important place.
5:45 So as I was saying point of control is the most important place on any chart.
5:49 The reason for that is that through volume profile you
5:53 basically track the big trading institutions right the big guys
5:57 the guys who move and manipulate the markets right and the point
6:02 of control the place where the heaviest volumes were traded.
6:05 This is basically the place where the big trading institutions were
6:09 most active where they placed the most of their trades, right?
6:14 So that's the most important place on the chart
6:17 and as you guys probably know institutions move the markets
6:22 and if you guys know where they are positioned then
6:26 I believe that you are ahead of 99% of retail traders.
6:29 It's kind of interesting because professional traders
6:32 so many of them almost majority of them I would say are using volume profile
6:38 at least as some addition to their trading strategy.
6:43 Institutional traders also use volume profile.
6:45 Like this is a standard tool of a professional trader.
6:48 But if you look at retail traders,
6:50 not so many of them actually use volume profile.
6:53 So what I'm trying to say is that even
6:56 if you just place the volume profile on your chart,
6:59 if you use simple daily profiles and you
7:02 just look at where the point of control is,
7:04 then if you do just this, you'll be still ahead of most retail traders, right?
7:09 Because you'll see something which they simply don't which
7:14 they can't see if they don't have the volume profile.
7:17 Now, in this video, we focus on the point of control.
7:20 And if you are an intraday trader,
7:22 then you'll probably be interested in a daily point of control,
7:25 you'll be trading that.
7:27 If you are long-term trader, then probably it's going to be uh
7:31 for example yearly or monthly point of control.
7:33 Let me actually show you.
7:34 Let me go to the chart.
7:36 All right.
7:36 So, uh this is a intraday chart, a 30 minute time frame.
7:40 If you look here, I have daily profiles, right?
7:43 Every day one profile and this is the daily point of control in here.
7:49 Then there's daily point of control in here.
7:52 Then there's daily point of control in here.
7:54 And if you're a day trader, you are going to be interested probably
7:59 mostly in the daily point of control, right?
8:01 The place where most volumes were traded in a given day, right?
8:06 But on the other hand, if you are for example long-term investor,
8:10 then you know you'll use workspace for example like this.
8:14 This is my swing trading workspace where I trade on the daily charts.
8:19 And in here I have yearly volume profiles.
8:22 Right?
8:23 So if I trade point of controls here then I'm interested
8:28 in this point of control which is point of control of the whole year.
8:33 I'll be interested in this point of control
8:36 because this is current year point of control.
8:39 Right?
8:39 So depending on the time frame you trade,
8:43 you should think of what kind of volume profile you actually want to trade.
8:46 Most of you are probably going to be intraday traders.
8:49 So we are going to focus mostly on trading daily point
8:54 of control which you can see right here on this intraday trading workspace.
8:58 Now the reason why I'm shooting this video and why point of control is
9:03 so important is that because it is a strong support and strong resistance level.
9:08 Right?
9:08 As I was saying, point of control is
9:12 a place where institutions placed most of their trading orders.
9:15 Right.
9:16 So if you look at this picture at this daily
9:20 volume profile and the point of control in here,
9:23 then what you basically want to do is
9:26 that if price revisits this place in the future,
9:29 makes a pull back to this place in the future
9:31 to this level to the point of control,
9:33 then the institutional traders who are active in here,
9:36 who created this point of control, will become active again.
9:40 They'll defend this place and they're likely to push the price up from here.
9:45 This is a long trade scenario.
9:48 Long trade scenario would look like this, right?
9:51 Pull back from below the point of control and then you go short from the level.
9:57 So basically the logic behind what I'm going to show you is institutions
10:02 defending the place where they were active before which is the point of control.
10:07 Okay.
10:07 So let me show you long trade scenario.
10:11 Let's take a look at this volume profile.
10:13 It has a very nicely visible point of control which is right here at this level.
10:19 That's the point of control.
10:20 Let me draw a line here.
10:22 The price went up from this point of control made
10:26 a pullback to it and then the buyers who are active here
10:30 those institutions started to buy aggressively defend the long positions which
10:35 they placed in here and result is that the price went up.
10:41 All right.
10:42 So that's the long trade scenario.
10:45 A short trade scenario is take a look at this profile
10:50 and the heaviest volumes in this profile right here.
10:54 This is where the volume profile is the widest and this is the point of control.
11:00 And take a look at this.
11:02 Price made a pull back to this level.
11:05 And then the sellers who are active here,
11:09 those institutional sellers started to sell
11:11 and that resulted in the price going down.
11:15 Right?
11:16 So this is the short trade scenario now.
11:19 Here is a guide how exactly to trade the point of control.
11:25 So the first step is identify the point of control.
11:29 That's easy.
11:30 That's where the volume profile is the widest, right?
11:33 So it's this level.
11:34 This is the point of control.
11:36 Then you want to wait for the price to move away from the point of control.
11:42 Let's say that it goes up and then you wait for a pullback.
11:48 This is the pullback.
11:49 And then you enter the trade at first touch.
11:53 That means you go long from here.
11:56 And you also want to trade only the first test.
11:59 Right?
12:00 That's at least how I trade this.
12:02 I only traded the first test because in my opinion
12:06 and experience uh they have higher probability of a successful reaction.
12:10 A short trade scenario would be again uh you mark
12:16 the point of control and if the price goes down
12:21 from the point of control you wait for the pullback
12:24 and when the price hits the point of control you go short.
12:28 Right?
12:29 This is the short trade scenario.
12:31 Now what I actually do and what I currently prefer is an alternative method.
12:38 It's very very similar only you don't place the trade entry
12:44 at the point of control but at the beginning of the volume zone.
12:50 Let me show you.
12:52 uh because the way I look at it is that the support or resistance is not just
12:57 the point of control line but it's the whole
13:01 heavy volume zone where the point of control is.
13:04 So in this case this would be a whole support or resistance zone.
13:09 Let me do a little drawing here.
13:11 This is the whole zone right?
13:14 Support or resistance zone.
13:15 Not just the point of control but the volumes around it too.
13:21 So if the price goes up from there, makes a pullback,
13:26 then I don't actually place my trade at the point of control line,
13:32 but I place my trade at the beginning of that heavy volume zone, which is here.
13:38 This is my long trade entry at this place.
13:42 Uh the reason is that I started to notice that I'm missing many trades.
13:46 Uh when I was trading from the point of control
13:50 from that level exactly I was missing a lot of trades.
13:54 Many times the price just reacted a little bit sooner.
13:57 So I started to place uh the level the entry level
14:01 at the beginning of that heavy volume zone and my results improved a lot.
14:06 So this is a little you know tweak to that strategy
14:10 that I'm currently using and it works nicely for me.
14:14 So this is long trade scenario.
14:16 Uh short trade scenario would be if the price
14:19 went down from that point of control made
14:22 a pullback then the short would be from here
14:25 from the lower border of that heavy volume zone.
14:29 Right?
14:29 So that would be the short.
14:31 All right let's get to some examples.
14:34 So first take a look at this volume profile.
14:37 It has point of control in here.
14:39 So let me draw a line there at the point of control.
14:44 And what you do is you wait for the price
14:48 to move away from that point of control.
14:50 In this case it goes downwards.
14:51 That means sellers are in control.
14:53 So it was sellers who were active
14:56 in here accumulating their short positions here.
14:59 Then those sellers push the price downwards.
15:02 And currently we have the information that at the point
15:05 of control there are strong sellers, right?
15:07 So we wait for the pullback.
15:09 When price hits the point of control for the first time,
15:13 you hit the short and that's it.
15:16 There's also one more here.
15:18 Take a look at this profile.
15:21 It has point of control right here.
15:25 The price moves away from the point of control, makes pullback to it.
15:31 And this is where you enter short.
15:34 Right?
15:35 So this is a short trade scenario.
15:38 Now here we have a long trade scenario.
15:42 Take a look at this daily volume profile.
15:46 The point of control is right here.
15:49 Draw the line and you need to see the price move away from the point of control.
15:56 make a pullback to it and when it hits your level then you go long from there.
16:03 All right.
16:04 So that's the long trade scenario.
16:07 From here you go long.
16:09 Now in this example take a look at this volume profile right here.
16:14 And the point of control is here.
16:17 Now let me show you something.
16:20 If you are trading from the point of control
16:24 like this, then this would be the pullback.
16:27 You'd be looking to go long from here.
16:30 But as you can see, the price missed that.
16:33 And this is actually what was happening to me so often.
16:36 And that's why I started to trade from the beginning of the heavy volume zone.
16:41 So the way I trade this is I place
16:44 the level a little bit higher to the beginning
16:47 of that heavy volume zone which would be somewhere
16:50 in here and actually go long from this place.
16:54 As you can see price hit that level and immediately went up.
16:59 Right?
16:59 So beginning of a heavy volume zone did the trick.
17:04 All right.
17:05 Now, this is the same chart only zoomed out a bit.
17:10 And I want you to take a look at this profile.
17:14 It has the point of control right here.
17:16 And if I extend the point of control like
17:21 this, then you can see that after the pullback,
17:25 this would be where I would be looking for long.
17:28 But yeah, the price just missed that.
17:30 It would be missed trading opportunity.
17:31 At that point, I would just discard the level.
17:35 But as you now know, the way I trade this is I place
17:38 the level at the beginning of a heavy volume zone.
17:40 So it would be somewhere in here because this would
17:44 be the area where the heaviest volumes were traded.
17:47 So I would place my entry somewhere in here and it would be a winner.
17:55 Right?
17:55 So this is exactly why I've altered the strategy
18:00 a bit so I don't miss trades like these.
18:04 All right.
18:04 Now, what I wanted to show you is when not
18:08 to trade the point of control because this is also very important
18:13 knowing when a strategy does work and when it does not
18:17 because there's no strategy that would work all the time, right?
18:21 So, when not to trade the point of control.
18:25 When you notice that the market is going
18:28 sideways in sideways price channel like here then you
18:32 don't want to trade the strategy of point
18:35 of control pullbacks uh that I just showed you.
18:39 The reason is that point of control in a rotation
18:43 is usually somewhere in a around the center of the rotation.
18:46 So this is the point of control of the first profile.
18:50 Second profiles point of controls is in here.
18:53 Then there's point of control in here.
18:56 The last profile has point of control in here.
18:59 So as you can see, it is somewhere around the center of that rotation channel.
19:06 Right?
19:07 And when the market is moving like this, what you want to do,
19:13 you want to trade from the borders of the rotation,
19:18 longs from here, shorts from here towards the center of the rotation.
19:23 And the center of the rotation,
19:25 the point of control is actually a nice place where to take your profit.
19:30 When you are going, for example, long from here,
19:33 then the point of control is good place uh for the take profit, right?
19:37 It's not a support or resistance when the market is rotating.
19:41 In this case, it works as sort of a magnet.
19:44 The price is moving around it and the point of control is around the center.
19:50 Right?
19:51 So, this is where not to trade the point of control strategy.
19:55 In this case, you want to use the point of control as a takerit.
19:59 Now, talking about take-profit,
20:00 we also need to cover takerit and stop-loss placement for our strategy.
20:05 Right?
20:05 So uh the rules are very simple.
20:08 Let me show you.
20:09 Take a look at this profile.
20:12 This is the point of control.
20:14 So again what you do according to the strategy
20:18 you print a line here on the chart,
20:22 wait for the pullback and when price hits the level then you go short.
20:28 Right now let's discuss the stop-loss placement first.
20:32 Stop loss needs to go in low volume
20:36 area where nobody really was interested in trading.
20:39 Right?
20:39 So take a look at the profile and the low volume area would be in here.
20:46 This red line, perfect spot for the stop loss, right?
20:52 Because this is the heavy volume zone and this zone is a resistance.
21:00 The whole zone is a resistance like this.
21:06 And you want to place the stop behind
21:08 that resistance because if the price goes past the resistance,
21:11 there's no way of telling where it will go next, right?
21:15 So that's where you want to cut your losses.
21:18 So remember, stop loss needs to go behind a heavy volume barrier like in here.
21:26 Now talking about the takeprofit,
21:28 you want to take the profit before the price reaches heavy volume zone.
21:32 So if you look at this profile right here,
21:37 this is a heavy volume zone and that heavy
21:41 volume zone could potentially represent a strong support, right?
21:46 This could represent a support.
21:49 And when you are short from here,
21:52 you don't really want the price to hit a support and ruin your trade, right?
21:57 So when the price hits the beginning of the support,
22:01 which is here, this is where you take your profit, right?
22:05 At the beginning of the heavy volume zone.
22:08 So again the rule for the stop loss is stop loss goes behind a barrier
22:14 behind a barrier and take profit goes
22:18 before a heavy volume barrier right simple rules.
22:22 Now let me give you one more example to demonstrate this.
22:28 So take a look at this profile right here.
22:32 Nice P-shaped profile with point of control in here.
22:36 If you are trading with uh the alternative strategy that I currently prefer,
22:40 then you want to place the long level a little bit above
22:44 the point of control at the place where the heavy volumes are beginning.
22:48 So this would be the long trade entry
22:52 and stop should go behind this heavy volume zone.
22:57 So this red line is stop loss because this is the low volume area, right?
23:04 So the stop loss goes behind heavy volume zone according to our rules.
23:09 And now when the price reacts to our long,
23:13 we need to look for place to quit the trade.
23:17 And if you look at this profile, nice D-shaped profile,
23:21 then it has heavy volume zone with point of control in here.
23:26 The beginning of this heavy volume zone is right here.
23:31 And there's a chance that the price will react to it like this.
23:38 You don't want that when you are long, right?
23:42 So that's why you quit your trade in here when the price reaches
23:46 this barrier because the risk is that it will react to the barrier.
23:51 In this case, it did not react, but it could have.
23:54 And that's why you put the trade in here.
23:57 Right now, let me demonstrate this on a couple of more trades.
24:00 Those are real trades which I publish
24:03 for members of my trading course every day.
24:05 Those levels that I publish for them are published
24:08 in advance so everybody can trade them with me.
24:11 So let me now show you a couple of them
24:14 to demonstrate how we uh trade the point of control.
24:17 So this is a recent trade we took on the ENQ.
24:20 Um take a look at this profile here.
24:23 The point of control was right here and our level
24:28 where we went long from was this line.
24:31 The market opened with a gap.
24:34 Then the price went up from that point of control, returned back.
24:39 It was rather quick and from there reacted.
24:43 We went long here and the price went up.
24:49 The stop-loss placement regarding to the rules which I showed
24:52 you uh should be in here in this low volume area.
24:55 But what I've done instead, I placed it a little bit lower because I want
24:59 the trade to breathe and I placed it below this low.
25:04 So I placed the stop in here.
25:08 And regarding the takerit, if you look at this volume profile, this one,
25:13 this was the point of control, the place where the heaviest volumes were traded.
25:19 And this was where I took the takeprofit, right?
25:22 Because I didn't want to risk it.
25:24 I didn't want to risk that the price will react
25:26 to the point of control and go downwards again, right?
25:29 So that's why the take profit was in here.
25:31 As you can see, this is more or less riskreward ratio.
25:36 one trade.
25:37 My rule for this is that I want to trade at least with risk reorder ratio one.
25:44 All right, that's the minimum.
25:46 So this was risk reorder ratio one trade and yeah, this is how it went.
25:51 Uh let me show you one more.
25:54 This is a trade which I took recently on the US dollar Japanese yen.
25:58 This is a 30 minutes chart daily profiles.
26:01 And if you look at this profile,
26:04 then you know there's a point of control that stands out very nicely.
26:07 This is the point of control.
26:09 And again, I like to trade from the beginning
26:12 of that heavy volume zone where the point of control was formed.
26:16 So it was this level.
26:18 The price moved away from that point of control,
26:22 made a pullback and this is where the price hit that level.
26:27 And at first touch, this is uh where I went short.
26:32 The stop loss for this trade was in a low volume area.
26:38 It was in here.
26:40 And the takerit was based on heavy volume zone standing
26:44 in the way and it was this heavy volume zone.
26:49 So that's why the takerit was in here.
26:53 It was a trade with positive risk-to-reward ratio.
26:57 So, it was quite a good trade.
27:01 Okay, last one, last example.
27:03 This is US dollar, Canadian dollar.
27:06 And take a look at this profile here.
27:09 This is where the heaviest volumes and the point of control was.
27:14 I was trading from the beginning of that heavy volume zone.
27:18 So, this was my trade entry.
27:21 Went short from there.
27:22 My stop was in here.
27:25 If I extend this line, you can see that it was behind this heavy volume zone.
27:32 So, behind this barrier.
27:34 And regarding the takerit,
27:36 I actually didn't have a heavy volume zone standing in the way.
27:40 So, I was looking for some different barrier
27:42 that would stand in the way of this trade.
27:45 And uh there was a weekly VW up here.
27:47 That's the blue line.
27:49 So, I quit the trade when the price hit the weekly VWAP.
27:54 By the way, VWAP is also a good place for uh taking profits like this.
28:00 But, uh that's another topic for another video.
28:03 Uh this is how the trade went.
28:05 This is where I took the profit.
28:07 If I only had the patience, I would actually be able to quit the trade
28:11 before it hit the first heavy volume barrier.
28:14 The price actually reached this place.
28:16 So, it would be like insanely nice trade if I managed to hold it that long.
28:21 But, you know, I'm not like that.
28:23 I probably wouldn't be able to hold that trade that long.
28:26 So, that's why I was searching for a closer place
28:29 where the quit the trade and it was the VWAP.
28:31 Right?
28:32 If I had the patience, then I would, you know,
28:35 follow the rules and just quit the trade when
28:38 it hit the heavy volume zone in here for me.
28:41 That would be probably just, you know, too much to handle.
28:45 Anyways, as I was saying,
28:47 those levels are levels which are every day in the members area.
28:50 I do updates every day and all the members have access
28:54 to them and they know where I will be trading that day.
28:58 Uh I give them the levels in advance.
29:00 So they have hours and hours,
29:02 sometimes even days before the level which I marked for them to trade
29:06 gets hit and before you know they can trade it with me.
29:10 And if you guys want to join us
29:13 and get a volume profile trading education, get my indicators,
29:16 get access to my daily levels and swing trading levels,
29:19 get access to our tech support, then visit our website.
29:22 It is traderdale.com.
29:24 If you click trading course and tools,
29:26 then it will take you to this page and in here
29:31 you can get one of my educational and indicator packs.
29:34 If you're interested in volume profile trading,
29:37 then go for the volume profile pack which includes the volume profile course.
29:41 That's like 15 hours of volume profile training.
29:44 It includes my trading signals every day.
29:46 Includes my custommade volume profiles
29:48 for various trading platforms like Ninja Trader, Metatrader or Trading View.
29:53 So you can get that and join our members and uh we can trade together.
29:59 And if you guys are interested in trading with me
30:01 and other proper traders every day in the live trading room,
30:05 then you want to click the FTA button.
30:08 It stands for Funded Trader Academy.
30:11 Here's a page where you can learn more about the Funded Trader Academy.
30:14 You can book a call with us and uh we'll explain the service
30:18 and then you can decide whether or not uh this is right for you.
30:23 But let's now go back uh to the presentation because there is
30:26 something very important which I wanted to show you and that important thing
30:31 is what to do when the point of control fails because so
30:35 far I've been showing you nice scenarios and nice traits where the point
30:39 of control worked like a charm right but let's be real it
30:44 doesn't work like a charm all the time so um if point
30:48 of control fails that means that the there is a change of sentiment
30:53 And what you can do is you can take a reversal trade.
30:58 Reversal trade is that you trade the same
31:01 point of control again but from the other side.
31:04 Let me show you.
31:05 It will be easier if I do a little drawing here.
31:09 Um take a look at this profile.
31:13 Nice D-shaped profile, right?
31:14 The price moves away from that point of control.
31:19 That's the point of control line.
31:22 moves away from it, hits the point of control
31:26 in here and this is where you go short.
31:30 Right?
31:30 As you can see, it is a losing trade.
31:34 So, the point of control failed.
31:36 The price shot past that level.
31:38 Now, what comes into play is the reversal trade.
31:42 You extend this line a bit.
31:45 Wait for the pullback and at the same level, the same point of control,
31:51 you enter a reversal trade, which in this case is a long.
31:57 That's the reversal trade.
31:58 You would be surprised how often this works and how
32:03 often this reacts to the pip to the point of control.
32:07 Right?
32:07 So what I'm always saying to my students is point
32:10 of control just by itself is very very strong level.
32:14 If the price doesn't respect it and just shoots past it,
32:19 it is a very very important information.
32:21 It doesn't really mean that the point of control was a bad level to trade.
32:26 It simply means that buyers are stronger.
32:29 They pushed through and that the sentiment changed and we need to adapt.
32:34 Right?
32:35 So that's why you wait for the pullback and very
32:39 very often the market gives you the chance to enter
32:42 at that level again right very very often there is that pullback
32:47 and this is the reversal right if you previously went short
32:52 took a loss then reversal would be taking a long
32:56 from the same level from the same point of control let
33:00 me give you one more example of this take a look
33:04 at this profile Here this is the point of control, right?
33:10 Price moves away from the point of control,
33:13 makes a pullback, you go long and take a loss.
33:17 The price shoots past the level with no reaction at all.
33:21 So what you do is you wait for the pullback and when
33:25 the market gives you a chance to jump in a new short from here,
33:30 then you should do it.
33:32 As you can see, this would be just the perfect chart, right?
33:37 So, this is the reversal trade.
33:40 Ideal scenario is when the price shoots past the point
33:44 of control very very quickly with no reaction at all.
33:48 Even you know could be for example during macronuse.
33:52 It's completely fine if it shoots past your level in macron right.
33:57 So, this is the point of control.
33:59 The price shoots past it.
34:02 ideal scenario that you know this is aggressive candle huge
34:06 candle could be macronuous candle that's fine if there's no
34:11 reaction at all that's perfect scenario for the reversal right
34:16 now let's do a very very brief summary of uh
34:19 what we talked about today right so point of control
34:23 you should remember that it's the most important place
34:26 on the chart because it shows where institutions are positioned Because
34:31 of this, it works as a strong support and resistance zone.
34:35 And the way to trade this is you
34:38 want to trade pullbacks to the point of control.
34:41 This is a long trade scenario pullback.
34:44 This is a short trade scenario pullback.
34:47 Next thing to remember is that you shouldn't
34:51 trade the point of control when the market
34:54 is in rotation because in this case the point of control works as a magnet,
34:59 not as a support and resistance.
35:02 And last but not least, if point of control fails,
35:06 then you take a reversal trade, right?
35:09 So if this is the point of control, price goes up,
35:14 makes a pullback, you go long, but the price continues to go down.
35:21 Then you wait for a pullback and go short from there.
35:28 This is the reversal.
35:30 All right, guys.
35:31 So that's about it.
35:33 And here is a little gift as a thank you for staying until the end of the video.
35:39 Uh this is my bestselling book, Volume Profile: The Insiders Guide to Trading.
35:43 And uh I'm giving away free physical copies, and I'll even cover the shipping.
35:49 It's a gift from me to you for staying until the end.
35:52 I'll keep sending the books until they run out of stock.
35:56 And if you are in the US, just click the link below,
35:59 fill out the form, and I'll send it to you.
36:02 No strings attached.
36:03 Just enjoy the book and let me know how you like it.
36:07 All right, so that's about that.
36:09 Thanks for watching the video.
36:11 Thanks for sticking until the end and I'll
36:13 be looking forward to seeing you next time.
36:15 Until then, happy trading.